29
/
en
AIzaSyAYiBZKx7MnpbEhh9jyipgxe19OcubqV5w
April 1, 2024
87258
Bolivia
BOL
true
2
1
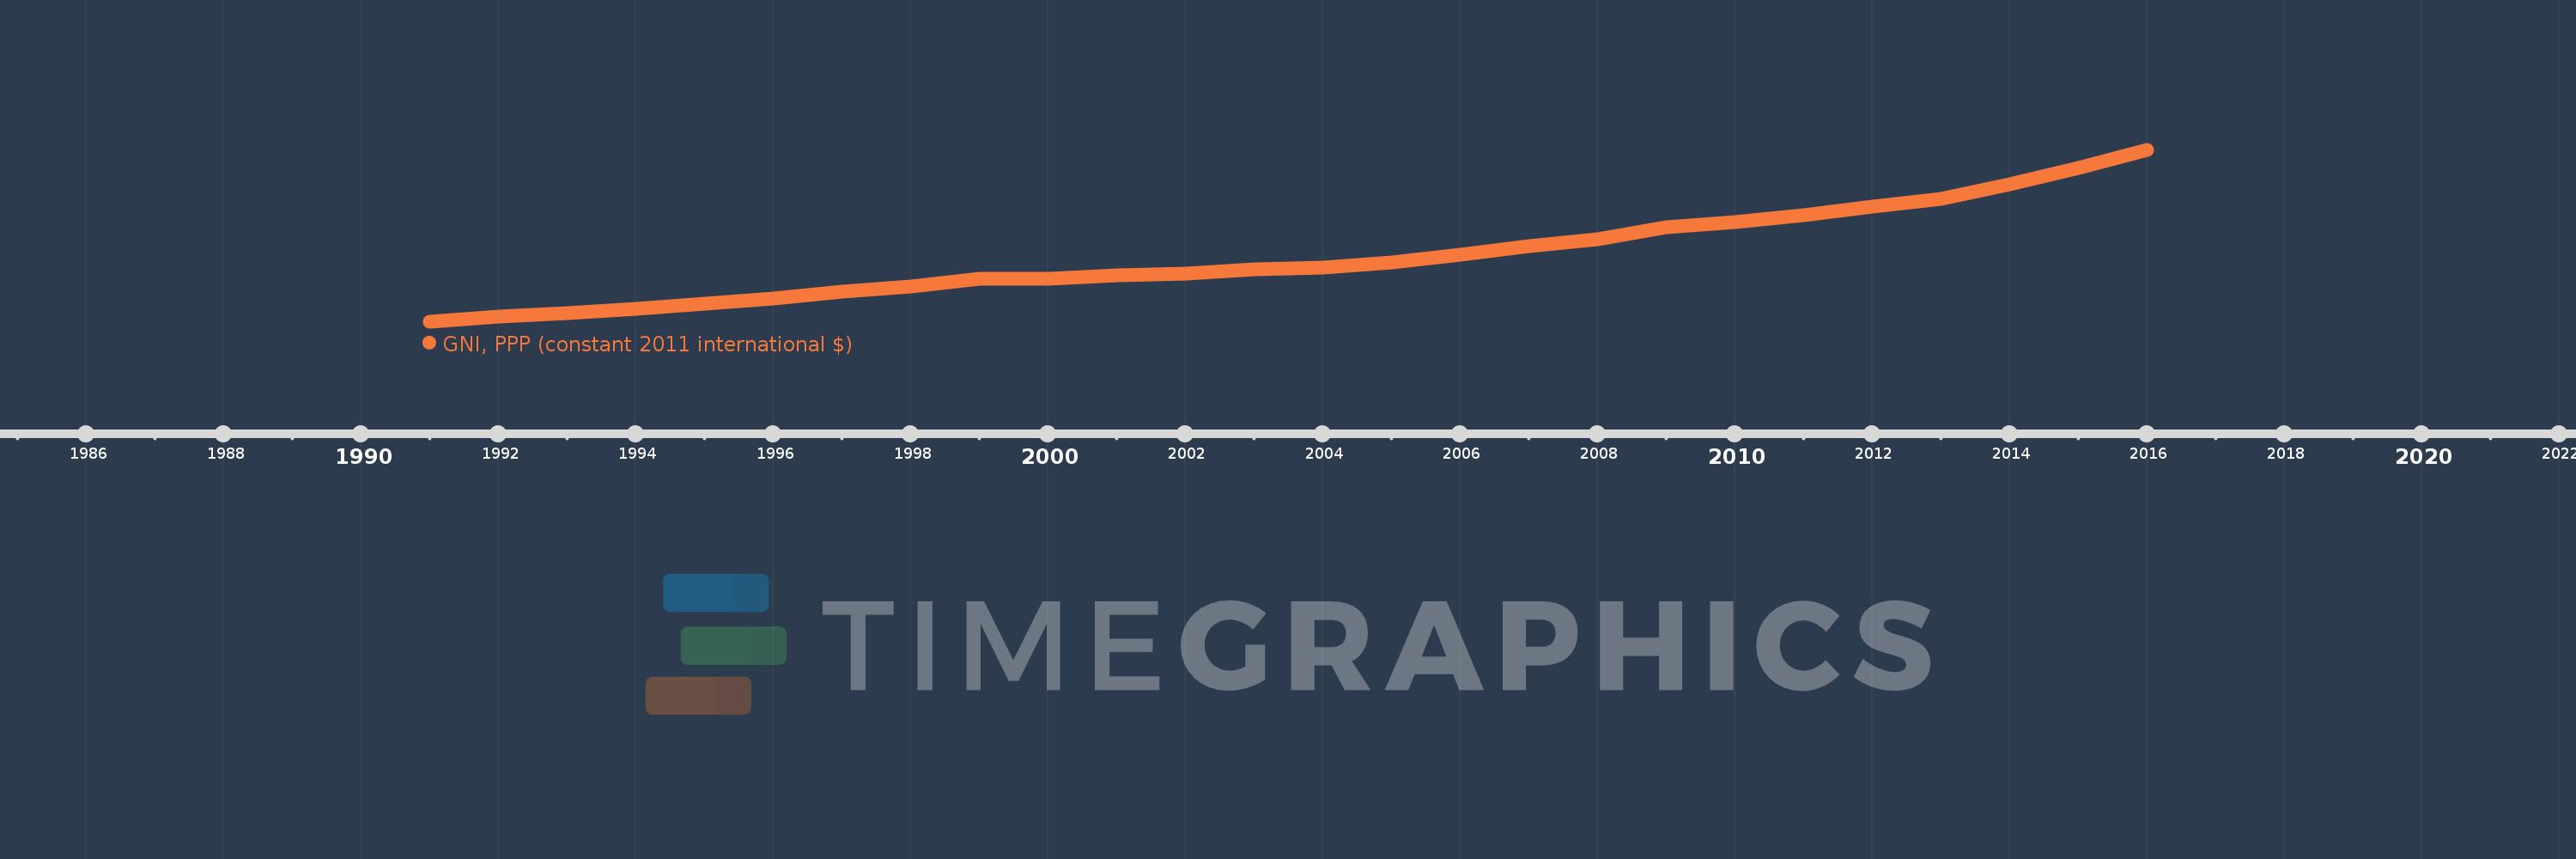
GNI, PPP (constant 2011 international $)
2016,2015,2014,2013,2012,2011,2010,2009,2008,2007,2006,2005,2004,2003,2002,2001,2000,1999,1998,1997,1996,1995,1994,1993,1992,1991
This statistics in other country:
AfghanistanAlbaniaAlgeriaAngolaAntigua and BarbudaArab WorldArgentinaArmeniaAustraliaAustriaAzerbaijanBahamas, TheBahrainBangladeshBarbadosBelarusBelgiumBelizeBeninBermudaBhutanBoliviaBosnia and HerzegovinaBotswanaBrazilBrunei DarussalamBulgariaBurkina FasoBurundiCabo VerdeCambodiaCameroonCanadaCaribbean small statesCentral African RepublicCentral Europe and the BalticsChadChileChinaColombiaComorosCongo, Dem. Rep.Congo, Rep.Costa RicaCote d'IvoireCroatiaCubaCyprusCzech RepublicDenmarkDominicaDominican RepublicEarly-demographic dividendEast Asia & PacificEast Asia & Pacific (excluding high income)East Asia & Pacific (IDA & IBRD countries)EcuadorEgypt, Arab Rep.El SalvadorEquatorial GuineaEritreaEstoniaEthiopiaEuro areaEurope & Central AsiaEurope & Central Asia (excluding high income)Europe & Central Asia (IDA & IBRD countries)European UnionFijiFinlandFranceGabonGambia, TheGeorgiaGermanyGhanaGreeceGrenadaGuatemalaGuineaGuinea-BissauGuyanaHaitiHeavily indebted poor countries (HIPC)High incomeHondurasHong Kong SAR, ChinaHungaryIBRD onlyIcelandIDA & IBRD totalIDA blendIDA onlyIDA totalIndiaIndonesiaIran, Islamic Rep.IraqIrelandIsraelItalyJamaicaJapanJordanKazakhstanKenyaKiribatiKorea, Rep.KosovoKuwaitKyrgyz RepublicLao PDRLate-demographic dividendLatin America & Caribbean Latin America & Caribbean (excluding high income)Latin America & the Caribbean (IDA & IBRD countries)LatviaLeast developed countries: UN classificationLebanonLesothoLiberiaLibyaLithuaniaLow & middle incomeLow incomeLower middle incomeLuxembourgMacao SAR, ChinaMacedonia, FYRMadagascarMalawiMalaysiaMaldivesMaliMaltaMarshall IslandsMauritaniaMauritiusMexicoMicronesia, Fed. Sts.Middle East & North AfricaMiddle East & North Africa (excluding high income)Middle East & North Africa (IDA & IBRD countries)Middle incomeMoldovaMongoliaMontenegroMoroccoMozambiqueMyanmarNamibiaNauruNepalNetherlandsNew ZealandNicaraguaNigerNigeriaNorth AmericaNorwayOECD membersOmanOther small statesPakistanPalauPanamaPapua New GuineaParaguayPeruPhilippinesPolandPortugalPost-demographic dividendPre-demographic dividendPuerto RicoQatarRomaniaRussian FederationRwandaSamoaSao Tome and PrincipeSaudi ArabiaSenegalSerbiaSeychellesSierra LeoneSingaporeSlovak RepublicSloveniaSmall statesSolomon IslandsSouth AfricaSouth AsiaSouth Asia (IDA & IBRD)South SudanSpainSri LankaSt. Kitts and NevisSt. LuciaSt. Vincent and the GrenadinesSub-Saharan Africa Sub-Saharan Africa (excluding high income)Sub-Saharan Africa (IDA & IBRD countries)SudanSurinameSwazilandSwedenSwitzerlandTajikistanTanzaniaThailandTimor-LesteTogoTongaTrinidad and TobagoTunisiaTurkeyTurkmenistanTuvaluUgandaUkraineUnited Arab EmiratesUnited KingdomUnited StatesUpper middle incomeUruguayUzbekistanVanuatuVenezuela, RBVietnamWest Bank and GazaWorldYemen, Rep.ZambiaZimbabwe Timeline:
This timeline shows a graph from 1991 to 2016 of Bolivia. No data until 1990. Number of actual observations by date: 26.
Source name:
World Development Indicators
Source organization:
World Bank, International Comparison Program database.
Categories, topics:
Economy & Growth
Last updated:
apr 23, 2017
Indicators value changes by year
Minimum:
24.273 bln
jan 1, 1991
Maximum:
67.945 bln
jan 1, 2016
At the date of observation
Value
Absolute change
Change from previous value
jan 1, 1991
24.273 bln
+24.273 bln
0.0%
jan 1, 1992
25.699 bln
+1.426 bln
5.87%
jan 1, 1993
26.443 bln
+744.245 mln
2.9%
jan 1, 1994
27.534 bln
+1.091 bln
4.13%
jan 1, 1995
28.94 bln
+1.406 bln
5.11%
jan 1, 1996
30.241 bln
+1.301 bln
4.5%
jan 1, 1997
31.886 bln
+1.644 bln
5.44%
jan 1, 1998
33.377 bln
+1.492 bln
4.68%
jan 1, 1999
35.252 bln
+1.875 bln
5.62%
jan 1, 2000
35.245 bln
-6.859 mln
-0.02%
jan 1, 2001
36.023 bln
+777.983 mln
2.21%
jan 1, 2002
36.662 bln
+638.426 mln
1.77%
jan 1, 2003
37.563 bln
+901.498 mln
2.46%
jan 1, 2004
38.113 bln
+550.2 mln
1.46%
jan 1, 2005
39.395 bln
+1.281 bln
3.36%
jan 1, 2006
41.324 bln
+1.93 bln
4.9%
jan 1, 2007
43.461 bln
+2.137 bln
5.17%
jan 1, 2008
45.336 bln
+1.875 bln
4.31%
jan 1, 2009
48.361 bln
+3.026 bln
6.67%
jan 1, 2010
49.7 bln
+1.339 bln
2.77%
jan 1, 2011
51.359 bln
+1.659 bln
3.34%
jan 1, 2012
53.691 bln
+2.332 bln
4.54%
jan 1, 2013
55.626 bln
+1.936 bln
3.61%
jan 1, 2014
59.322 bln
+3.695 bln
6.64%
jan 1, 2015
63.495 bln
+4.173 bln
7.03%
jan 1, 2016
67.945 bln
+4.45 bln
7.01%
Ranking of countries by current statistics by years


Comments: