29
/
en
AIzaSyAYiBZKx7MnpbEhh9jyipgxe19OcubqV5w
April 1, 2024
202950
Mozambique
MOZ
true
2
1
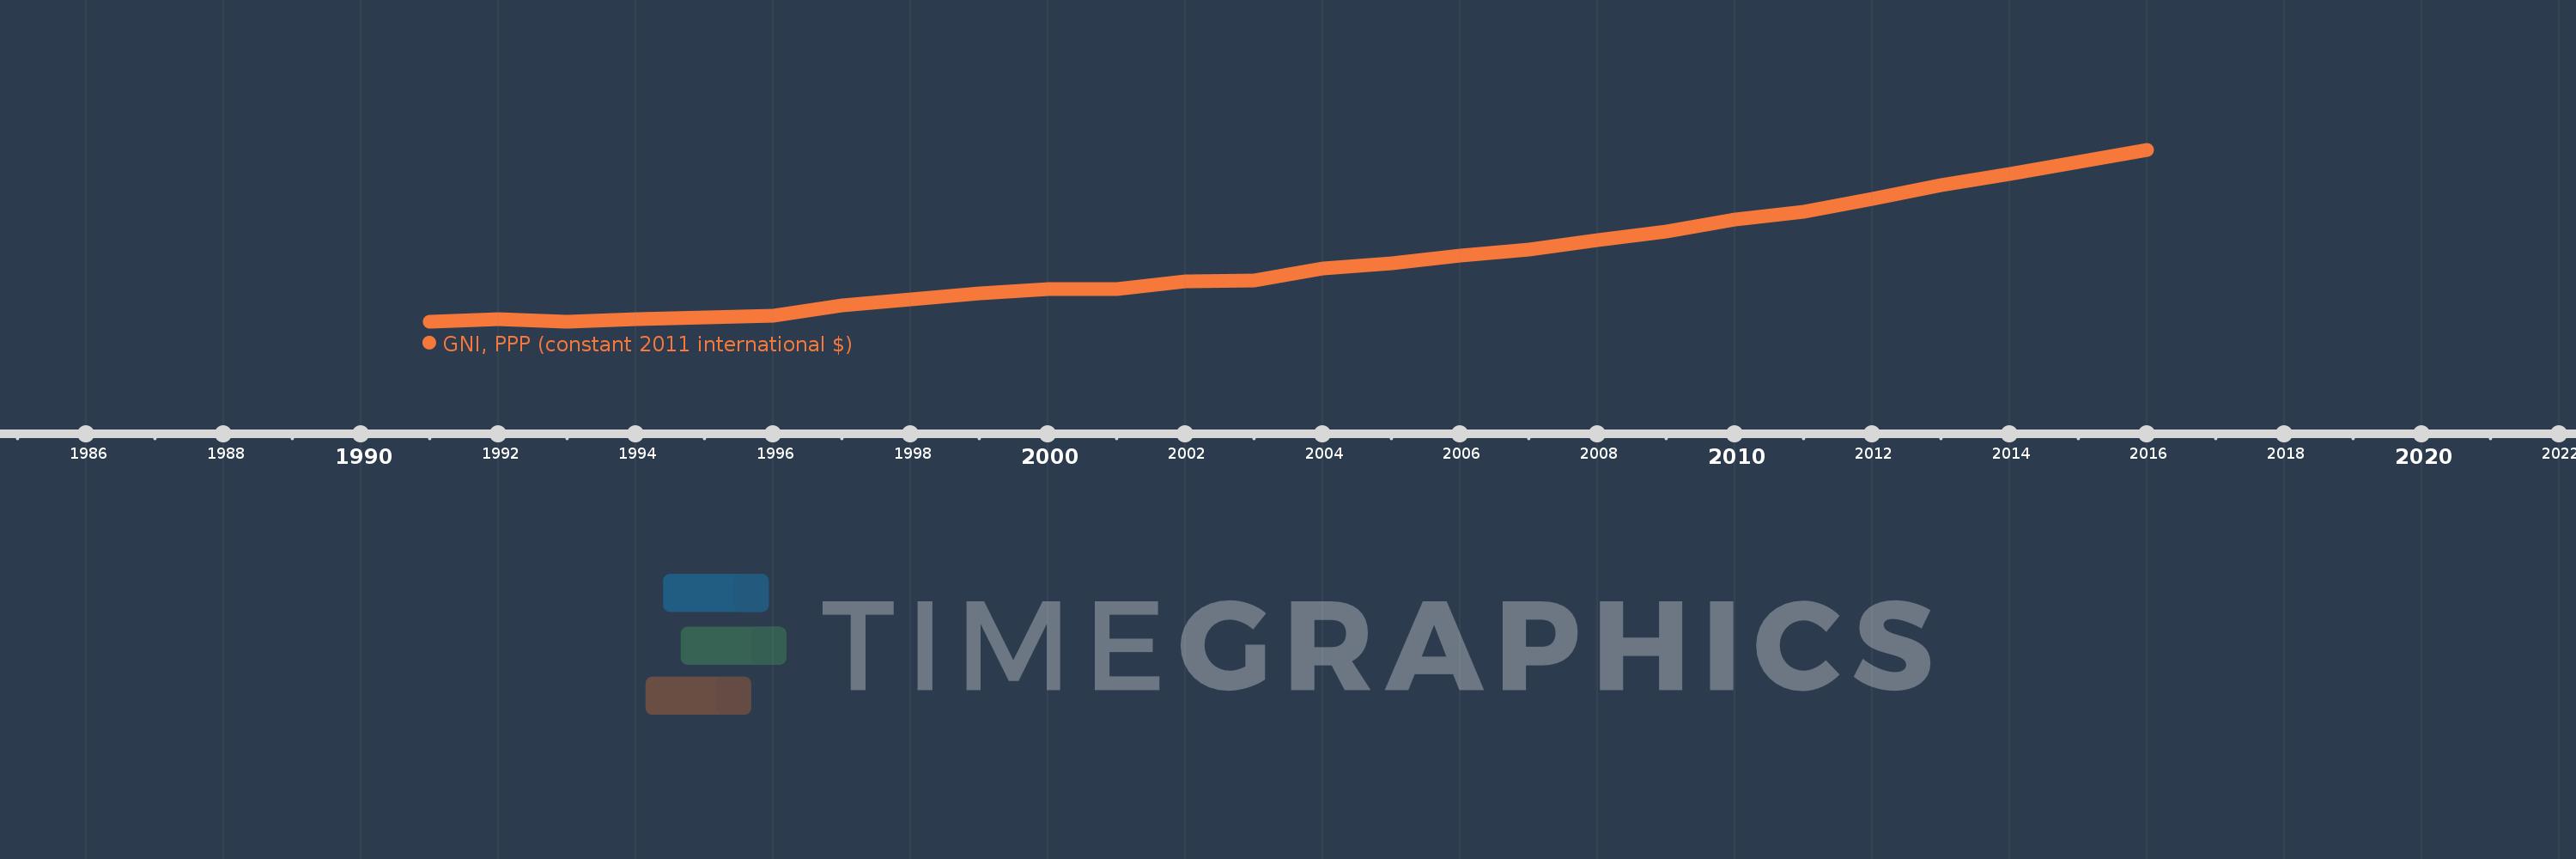
GNI, PPP (constant 2011 international $)
2016,2015,2014,2013,2012,2011,2010,2009,2008,2007,2006,2005,2004,2003,2002,2001,2000,1999,1998,1997,1996,1995,1994,1993,1992,1991
This statistics in other country:
AfghanistanAlbaniaAlgeriaAngolaAntigua and BarbudaArab WorldArgentinaArmeniaAustraliaAustriaAzerbaijanBahamas, TheBahrainBangladeshBarbadosBelarusBelgiumBelizeBeninBermudaBhutanBoliviaBosnia and HerzegovinaBotswanaBrazilBrunei DarussalamBulgariaBurkina FasoBurundiCabo VerdeCambodiaCameroonCanadaCaribbean small statesCentral African RepublicCentral Europe and the BalticsChadChileChinaColombiaComorosCongo, Dem. Rep.Congo, Rep.Costa RicaCote d'IvoireCroatiaCubaCyprusCzech RepublicDenmarkDominicaDominican RepublicEarly-demographic dividendEast Asia & PacificEast Asia & Pacific (excluding high income)East Asia & Pacific (IDA & IBRD countries)EcuadorEgypt, Arab Rep.El SalvadorEquatorial GuineaEritreaEstoniaEthiopiaEuro areaEurope & Central AsiaEurope & Central Asia (excluding high income)Europe & Central Asia (IDA & IBRD countries)European UnionFijiFinlandFranceGabonGambia, TheGeorgiaGermanyGhanaGreeceGrenadaGuatemalaGuineaGuinea-BissauGuyanaHaitiHeavily indebted poor countries (HIPC)High incomeHondurasHong Kong SAR, ChinaHungaryIBRD onlyIcelandIDA & IBRD totalIDA blendIDA onlyIDA totalIndiaIndonesiaIran, Islamic Rep.IraqIrelandIsraelItalyJamaicaJapanJordanKazakhstanKenyaKiribatiKorea, Rep.KosovoKuwaitKyrgyz RepublicLao PDRLate-demographic dividendLatin America & Caribbean Latin America & Caribbean (excluding high income)Latin America & the Caribbean (IDA & IBRD countries)LatviaLeast developed countries: UN classificationLebanonLesothoLiberiaLibyaLithuaniaLow & middle incomeLow incomeLower middle incomeLuxembourgMacao SAR, ChinaMacedonia, FYRMadagascarMalawiMalaysiaMaldivesMaliMaltaMarshall IslandsMauritaniaMauritiusMexicoMicronesia, Fed. Sts.Middle East & North AfricaMiddle East & North Africa (excluding high income)Middle East & North Africa (IDA & IBRD countries)Middle incomeMoldovaMongoliaMontenegroMoroccoMozambiqueMyanmarNamibiaNauruNepalNetherlandsNew ZealandNicaraguaNigerNigeriaNorth AmericaNorwayOECD membersOmanOther small statesPakistanPalauPanamaPapua New GuineaParaguayPeruPhilippinesPolandPortugalPost-demographic dividendPre-demographic dividendPuerto RicoQatarRomaniaRussian FederationRwandaSamoaSao Tome and PrincipeSaudi ArabiaSenegalSerbiaSeychellesSierra LeoneSingaporeSlovak RepublicSloveniaSmall statesSolomon IslandsSouth AfricaSouth AsiaSouth Asia (IDA & IBRD)South SudanSpainSri LankaSt. Kitts and NevisSt. LuciaSt. Vincent and the GrenadinesSub-Saharan Africa Sub-Saharan Africa (excluding high income)Sub-Saharan Africa (IDA & IBRD countries)SudanSurinameSwazilandSwedenSwitzerlandTajikistanTanzaniaThailandTimor-LesteTogoTongaTrinidad and TobagoTunisiaTurkeyTurkmenistanTuvaluUgandaUkraineUnited Arab EmiratesUnited KingdomUnited StatesUpper middle incomeUruguayUzbekistanVanuatuVenezuela, RBVietnamWest Bank and GazaWorldYemen, Rep.ZambiaZimbabwe Timeline:
This timeline shows a graph from 1991 to 2016 of Mozambique. No data until 1990. Number of actual observations by date: 26.
Source name:
World Development Indicators
Source organization:
World Bank, International Comparison Program database.
Categories, topics:
Economy & Growth
Last updated:
apr 23, 2017
Indicators value changes by year
Minimum:
4.712 bln
jan 1, 1993
Maximum:
30.803 bln
jan 1, 2016
At the date of observation
Value
Absolute change
Change from previous value
jan 1, 1991
4.814 bln
+4.814 bln
0.0%
jan 1, 1992
5.086 bln
+271.804 mln
5.65%
jan 1, 1993
4.712 bln
-373.453 mln
-7.34%
jan 1, 1994
5.147 bln
+434.741 mln
9.23%
jan 1, 1995
5.459 bln
+312.046 mln
6.06%
jan 1, 1996
5.65 bln
+191.307 mln
3.5%
jan 1, 1997
7.277 bln
+1.627 bln
28.79%
jan 1, 1998
8.109 bln
+831.936 mln
11.43%
jan 1, 1999
9.012 bln
+902.315 mln
11.13%
jan 1, 2000
9.749 bln
+737.579 mln
8.18%
jan 1, 2001
9.771 bln
+22.322 mln
0.23%
jan 1, 2002
10.922 bln
+1.151 bln
11.77%
jan 1, 2003
11.063 bln
+141.472 mln
1.3%
jan 1, 2004
12.874 bln
+1.811 bln
16.37%
jan 1, 2005
13.685 bln
+811.341 mln
6.3%
jan 1, 2006
14.822 bln
+1.137 bln
8.31%
jan 1, 2007
15.774 bln
+951.385 mln
6.42%
jan 1, 2008
17.167 bln
+1.394 bln
8.84%
jan 1, 2009
18.47 bln
+1.302 bln
7.58%
jan 1, 2010
20.291 bln
+1.822 bln
9.86%
jan 1, 2011
21.492 bln
+1.2 bln
5.92%
jan 1, 2012
23.467 bln
+1.976 bln
9.19%
jan 1, 2013
25.441 bln
+1.974 bln
8.41%
jan 1, 2014
27.228 bln
+1.787 bln
7.02%
jan 1, 2015
29.002 bln
+1.774 bln
6.52%
jan 1, 2016
30.803 bln
+1.801 bln
6.21%
Ranking of countries by current statistics by years


Comments: