29
/
en
AIzaSyAYiBZKx7MnpbEhh9jyipgxe19OcubqV5w
April 1, 2024
207969
Netherlands
NLD
true
2
1
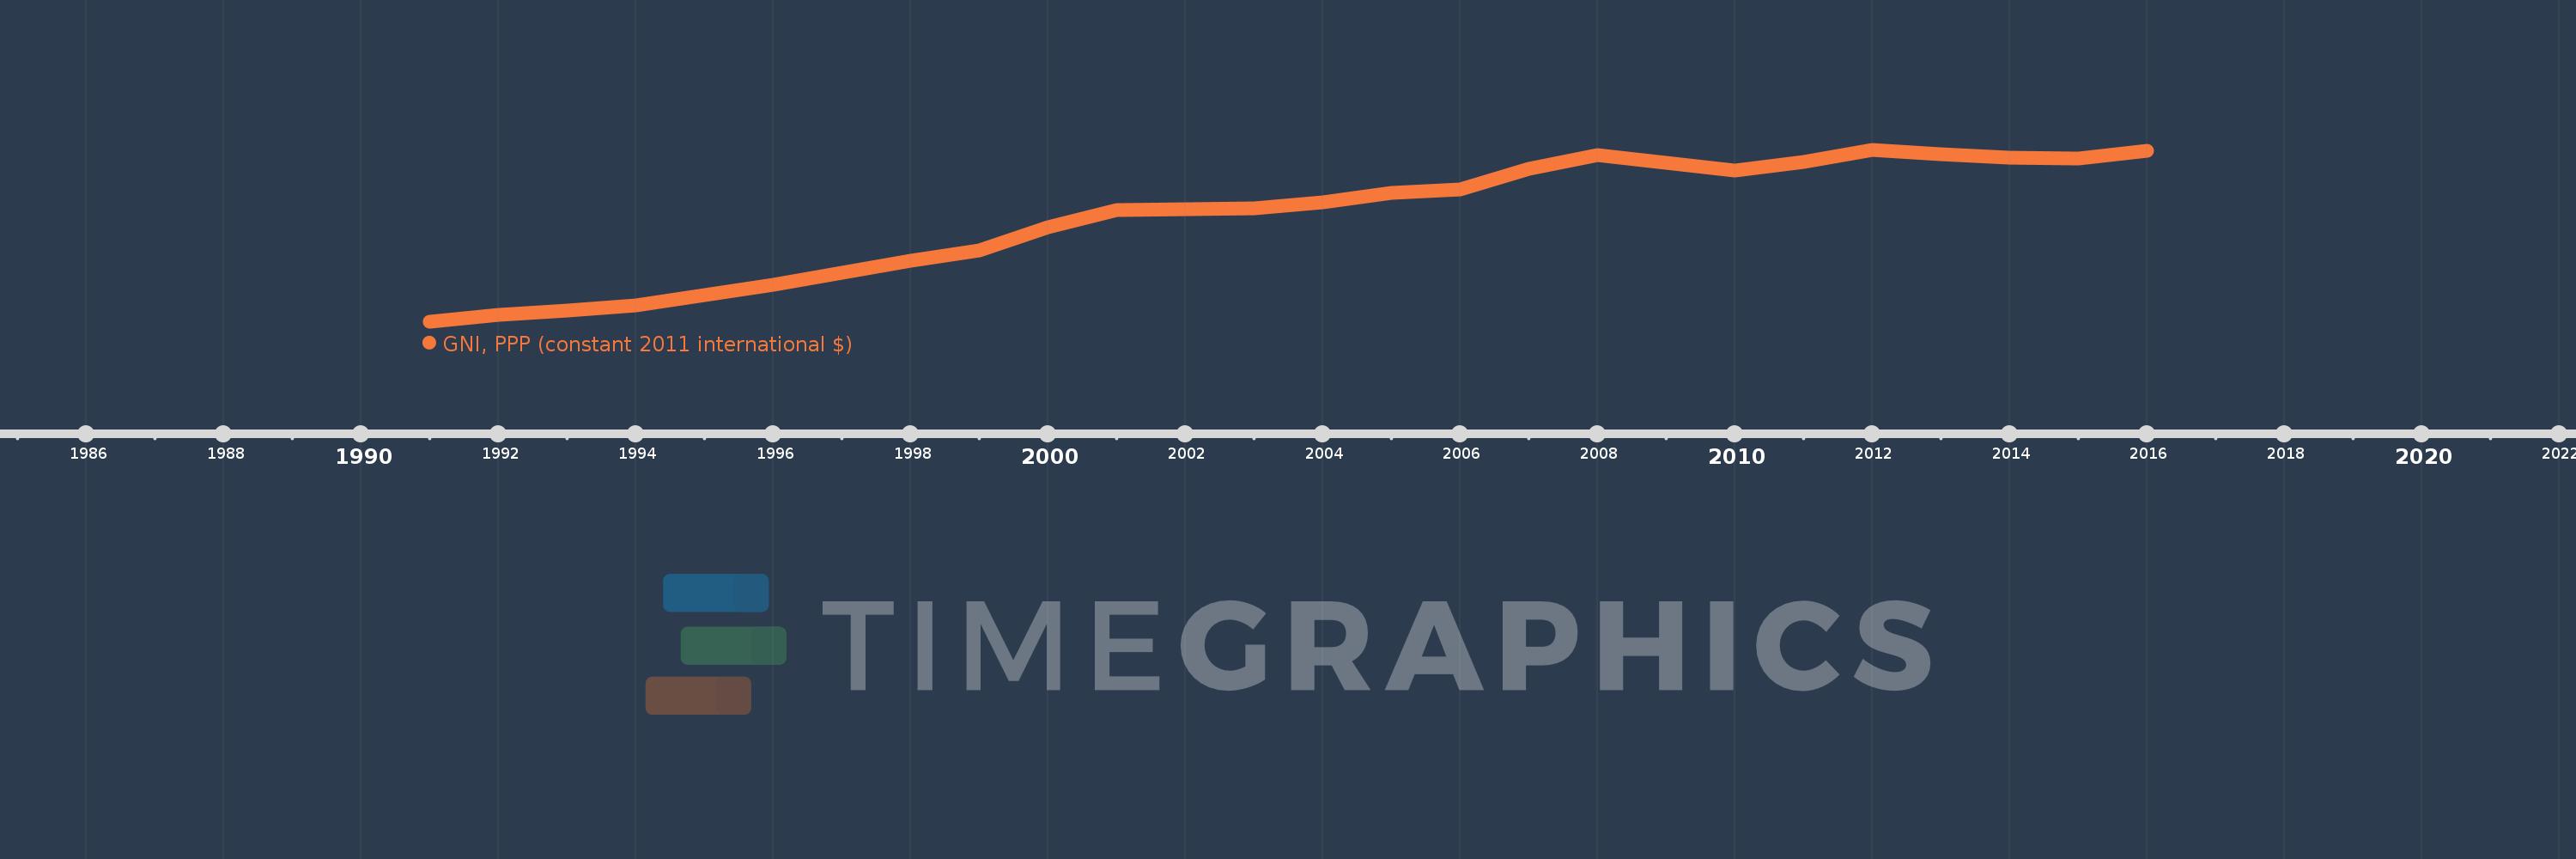
GNI, PPP (constant 2011 international $)
2016,2015,2014,2013,2012,2011,2010,2009,2008,2007,2006,2005,2004,2003,2002,2001,2000,1999,1998,1997,1996,1995,1994,1993,1992,1991
This statistics in other country:
AfghanistanAlbaniaAlgeriaAngolaAntigua and BarbudaArab WorldArgentinaArmeniaAustraliaAustriaAzerbaijanBahamas, TheBahrainBangladeshBarbadosBelarusBelgiumBelizeBeninBermudaBhutanBoliviaBosnia and HerzegovinaBotswanaBrazilBrunei DarussalamBulgariaBurkina FasoBurundiCabo VerdeCambodiaCameroonCanadaCaribbean small statesCentral African RepublicCentral Europe and the BalticsChadChileChinaColombiaComorosCongo, Dem. Rep.Congo, Rep.Costa RicaCote d'IvoireCroatiaCubaCyprusCzech RepublicDenmarkDominicaDominican RepublicEarly-demographic dividendEast Asia & PacificEast Asia & Pacific (excluding high income)East Asia & Pacific (IDA & IBRD countries)EcuadorEgypt, Arab Rep.El SalvadorEquatorial GuineaEritreaEstoniaEthiopiaEuro areaEurope & Central AsiaEurope & Central Asia (excluding high income)Europe & Central Asia (IDA & IBRD countries)European UnionFijiFinlandFranceGabonGambia, TheGeorgiaGermanyGhanaGreeceGrenadaGuatemalaGuineaGuinea-BissauGuyanaHaitiHeavily indebted poor countries (HIPC)High incomeHondurasHong Kong SAR, ChinaHungaryIBRD onlyIcelandIDA & IBRD totalIDA blendIDA onlyIDA totalIndiaIndonesiaIran, Islamic Rep.IraqIrelandIsraelItalyJamaicaJapanJordanKazakhstanKenyaKiribatiKorea, Rep.KosovoKuwaitKyrgyz RepublicLao PDRLate-demographic dividendLatin America & Caribbean Latin America & Caribbean (excluding high income)Latin America & the Caribbean (IDA & IBRD countries)LatviaLeast developed countries: UN classificationLebanonLesothoLiberiaLibyaLithuaniaLow & middle incomeLow incomeLower middle incomeLuxembourgMacao SAR, ChinaMacedonia, FYRMadagascarMalawiMalaysiaMaldivesMaliMaltaMarshall IslandsMauritaniaMauritiusMexicoMicronesia, Fed. Sts.Middle East & North AfricaMiddle East & North Africa (excluding high income)Middle East & North Africa (IDA & IBRD countries)Middle incomeMoldovaMongoliaMontenegroMoroccoMozambiqueMyanmarNamibiaNauruNepalNetherlandsNew ZealandNicaraguaNigerNigeriaNorth AmericaNorwayOECD membersOmanOther small statesPakistanPalauPanamaPapua New GuineaParaguayPeruPhilippinesPolandPortugalPost-demographic dividendPre-demographic dividendPuerto RicoQatarRomaniaRussian FederationRwandaSamoaSao Tome and PrincipeSaudi ArabiaSenegalSerbiaSeychellesSierra LeoneSingaporeSlovak RepublicSloveniaSmall statesSolomon IslandsSouth AfricaSouth AsiaSouth Asia (IDA & IBRD)South SudanSpainSri LankaSt. Kitts and NevisSt. LuciaSt. Vincent and the GrenadinesSub-Saharan Africa Sub-Saharan Africa (excluding high income)Sub-Saharan Africa (IDA & IBRD countries)SudanSurinameSwazilandSwedenSwitzerlandTajikistanTanzaniaThailandTimor-LesteTogoTongaTrinidad and TobagoTunisiaTurkeyTurkmenistanTuvaluUgandaUkraineUnited Arab EmiratesUnited KingdomUnited StatesUpper middle incomeUruguayUzbekistanVanuatuVenezuela, RBVietnamWest Bank and GazaWorldYemen, Rep.ZambiaZimbabwe Timeline:
This timeline shows a graph from 1991 to 2016 of Netherlands. No data until 1990. Number of actual observations by date: 26.
Source name:
World Development Indicators
Source organization:
World Bank, International Comparison Program database.
Categories, topics:
Economy & Growth
Last updated:
apr 23, 2017
Indicators value changes by year
Minimum:
479.165 bln
jan 1, 1991
Maximum:
783.058 bln
jan 1, 2012
At the date of observation
Value
Absolute change
Change from previous value
jan 1, 1991
479.165 bln
+479.165 bln
0.0%
jan 1, 1992
492.39 bln
+13.225 bln
2.76%
jan 1, 1993
499.394 bln
+7.004 bln
1.42%
jan 1, 1994
508.431 bln
+9.037 bln
1.81%
jan 1, 1995
526.119 bln
+17.688 bln
3.48%
jan 1, 1996
545.708 bln
+19.589 bln
3.72%
jan 1, 1997
565.882 bln
+20.174 bln
3.7%
jan 1, 1998
586.83 bln
+20.948 bln
3.7%
jan 1, 1999
605.691 bln
+18.861 bln
3.21%
jan 1, 2000
647.225 bln
+41.534 bln
6.86%
jan 1, 2001
677.528 bln
+30.303 bln
4.68%
jan 1, 2002
678.067 bln
+539.497 mln
0.08%
jan 1, 2003
680.457 bln
+2.39 bln
0.35%
jan 1, 2004
690.904 bln
+10.447 bln
1.54%
jan 1, 2005
707.409 bln
+16.505 bln
2.39%
jan 1, 2006
712.943 bln
+5.535 bln
0.78%
jan 1, 2007
750.341 bln
+37.398 bln
5.25%
jan 1, 2008
773.911 bln
+23.569 bln
3.14%
jan 1, 2009
760.764 bln
-13.146 bln
-1.7%
jan 1, 2010
746.707 bln
-14.057 bln
-1.85%
jan 1, 2011
762.629 bln
+15.921 bln
2.13%
jan 1, 2012
783.058 bln
+20.429 bln
2.68%
jan 1, 2013
776.504 bln
-6.554 bln
-0.84%
jan 1, 2014
770.058 bln
-6.446 bln
-0.83%
jan 1, 2015
768.315 bln
-1.742 bln
-0.23%
jan 1, 2016
782.507 bln
+14.192 bln
1.85%
Ranking of countries by current statistics by years


Comments: