29
/
en
AIzaSyAYiBZKx7MnpbEhh9jyipgxe19OcubqV5w
April 1, 2024
107277
Colombia
COL
true
2
1
GNI, PPP (constant 2011 international $)
2016,2015,2014,2013,2012,2011,2010,2009,2008,2007,2006,2005,2004,2003,2002,2001,2000,1999,1998,1997,1996,1995,1994,1993,1992,1991
This statistics in other country:
AfghanistanAlbaniaAlgeriaAngolaAntigua and BarbudaArab WorldArgentinaArmeniaAustraliaAustriaAzerbaijanBahamas, TheBahrainBangladeshBarbadosBelarusBelgiumBelizeBeninBermudaBhutanBoliviaBosnia and HerzegovinaBotswanaBrazilBrunei DarussalamBulgariaBurkina FasoBurundiCabo VerdeCambodiaCameroonCanadaCaribbean small statesCentral African RepublicCentral Europe and the BalticsChadChileChinaColombiaComorosCongo, Dem. Rep.Congo, Rep.Costa RicaCote d'IvoireCroatiaCubaCyprusCzech RepublicDenmarkDominicaDominican RepublicEarly-demographic dividendEast Asia & PacificEast Asia & Pacific (excluding high income)East Asia & Pacific (IDA & IBRD countries)EcuadorEgypt, Arab Rep.El SalvadorEquatorial GuineaEritreaEstoniaEthiopiaEuro areaEurope & Central AsiaEurope & Central Asia (excluding high income)Europe & Central Asia (IDA & IBRD countries)European UnionFijiFinlandFranceGabonGambia, TheGeorgiaGermanyGhanaGreeceGrenadaGuatemalaGuineaGuinea-BissauGuyanaHaitiHeavily indebted poor countries (HIPC)High incomeHondurasHong Kong SAR, ChinaHungaryIBRD onlyIcelandIDA & IBRD totalIDA blendIDA onlyIDA totalIndiaIndonesiaIran, Islamic Rep.IraqIrelandIsraelItalyJamaicaJapanJordanKazakhstanKenyaKiribatiKorea, Rep.KosovoKuwaitKyrgyz RepublicLao PDRLate-demographic dividendLatin America & Caribbean Latin America & Caribbean (excluding high income)Latin America & the Caribbean (IDA & IBRD countries)LatviaLeast developed countries: UN classificationLebanonLesothoLiberiaLibyaLithuaniaLow & middle incomeLow incomeLower middle incomeLuxembourgMacao SAR, ChinaMacedonia, FYRMadagascarMalawiMalaysiaMaldivesMaliMaltaMarshall IslandsMauritaniaMauritiusMexicoMicronesia, Fed. Sts.Middle East & North AfricaMiddle East & North Africa (excluding high income)Middle East & North Africa (IDA & IBRD countries)Middle incomeMoldovaMongoliaMontenegroMoroccoMozambiqueMyanmarNamibiaNauruNepalNetherlandsNew ZealandNicaraguaNigerNigeriaNorth AmericaNorwayOECD membersOmanOther small statesPakistanPalauPanamaPapua New GuineaParaguayPeruPhilippinesPolandPortugalPost-demographic dividendPre-demographic dividendPuerto RicoQatarRomaniaRussian FederationRwandaSamoaSao Tome and PrincipeSaudi ArabiaSenegalSerbiaSeychellesSierra LeoneSingaporeSlovak RepublicSloveniaSmall statesSolomon IslandsSouth AfricaSouth AsiaSouth Asia (IDA & IBRD)South SudanSpainSri LankaSt. Kitts and NevisSt. LuciaSt. Vincent and the GrenadinesSub-Saharan Africa Sub-Saharan Africa (excluding high income)Sub-Saharan Africa (IDA & IBRD countries)SudanSurinameSwazilandSwedenSwitzerlandTajikistanTanzaniaThailandTimor-LesteTogoTongaTrinidad and TobagoTunisiaTurkeyTurkmenistanTuvaluUgandaUkraineUnited Arab EmiratesUnited KingdomUnited StatesUpper middle incomeUruguayUzbekistanVanuatuVenezuela, RBVietnamWest Bank and GazaWorldYemen, Rep.ZambiaZimbabwe Timeline:
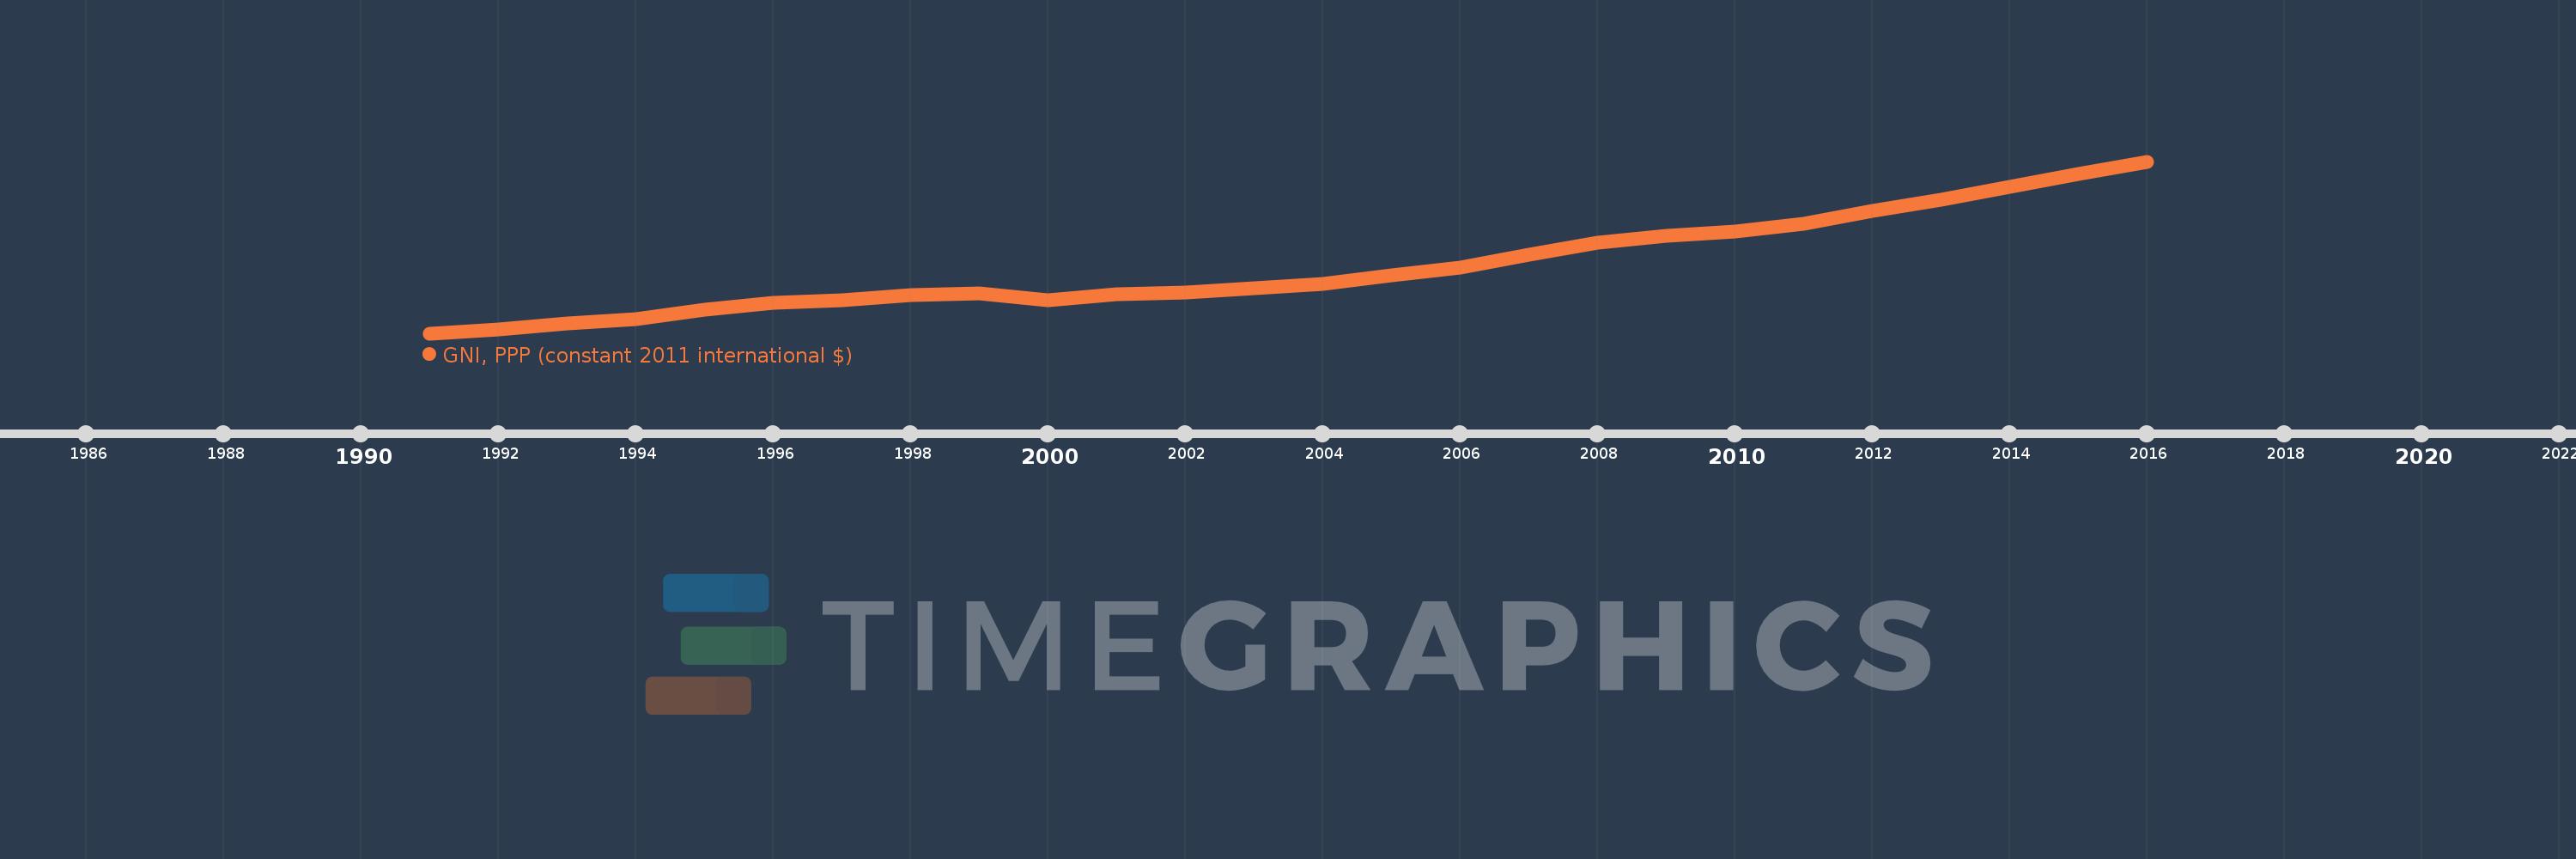
This timeline shows a graph from 1991 to 2016 of Colombia. No data until 1990. Number of actual observations by date: 26.
Source name:
World Development Indicators
Source organization:
World Bank, International Comparison Program database.
Categories, topics:
Economy & Growth
Last updated:
apr 23, 2017
Indicators value changes by year
Minimum:
245.561 bln
jan 1, 1991
Maximum:
615.878 bln
jan 1, 2016
At the date of observation
Value
Absolute change
Change from previous value
jan 1, 1991
245.561 bln
+245.561 bln
0.0%
jan 1, 1992
253.023 bln
+7.462 bln
3.04%
jan 1, 1993
266.787 bln
+13.764 bln
5.44%
jan 1, 1994
275.605 bln
+8.818 bln
3.31%
jan 1, 1995
296.35 bln
+20.745 bln
7.53%
jan 1, 1996
311.983 bln
+15.632 bln
5.27%
jan 1, 1997
317.109 bln
+5.127 bln
1.64%
jan 1, 1998
327.605 bln
+10.496 bln
3.31%
jan 1, 1999
331.028 bln
+3.422 bln
1.04%
jan 1, 2000
317.163 bln
-13.864 bln
-4.19%
jan 1, 2001
329.811 bln
+12.648 bln
3.99%
jan 1, 2002
334.414 bln
+4.603 bln
1.4%
jan 1, 2003
342.017 bln
+7.604 bln
2.27%
jan 1, 2004
352.826 bln
+10.809 bln
3.16%
jan 1, 2005
371.28 bln
+18.453 bln
5.23%
jan 1, 2006
388.066 bln
+16.787 bln
4.52%
jan 1, 2007
414.3 bln
+26.234 bln
6.76%
jan 1, 2008
441.613 bln
+27.313 bln
6.59%
jan 1, 2009
456.022 bln
+14.409 bln
3.26%
jan 1, 2010
465.531 bln
+9.509 bln
2.09%
jan 1, 2011
481.863 bln
+16.332 bln
3.51%
jan 1, 2012
508.887 bln
+27.024 bln
5.61%
jan 1, 2013
532.761 bln
+23.874 bln
4.69%
jan 1, 2014
560.911 bln
+28.149 bln
5.28%
jan 1, 2015
588.323 bln
+27.412 bln
4.89%
jan 1, 2016
615.878 bln
+27.555 bln
4.68%
Ranking of countries by current statistics by years


Comments: