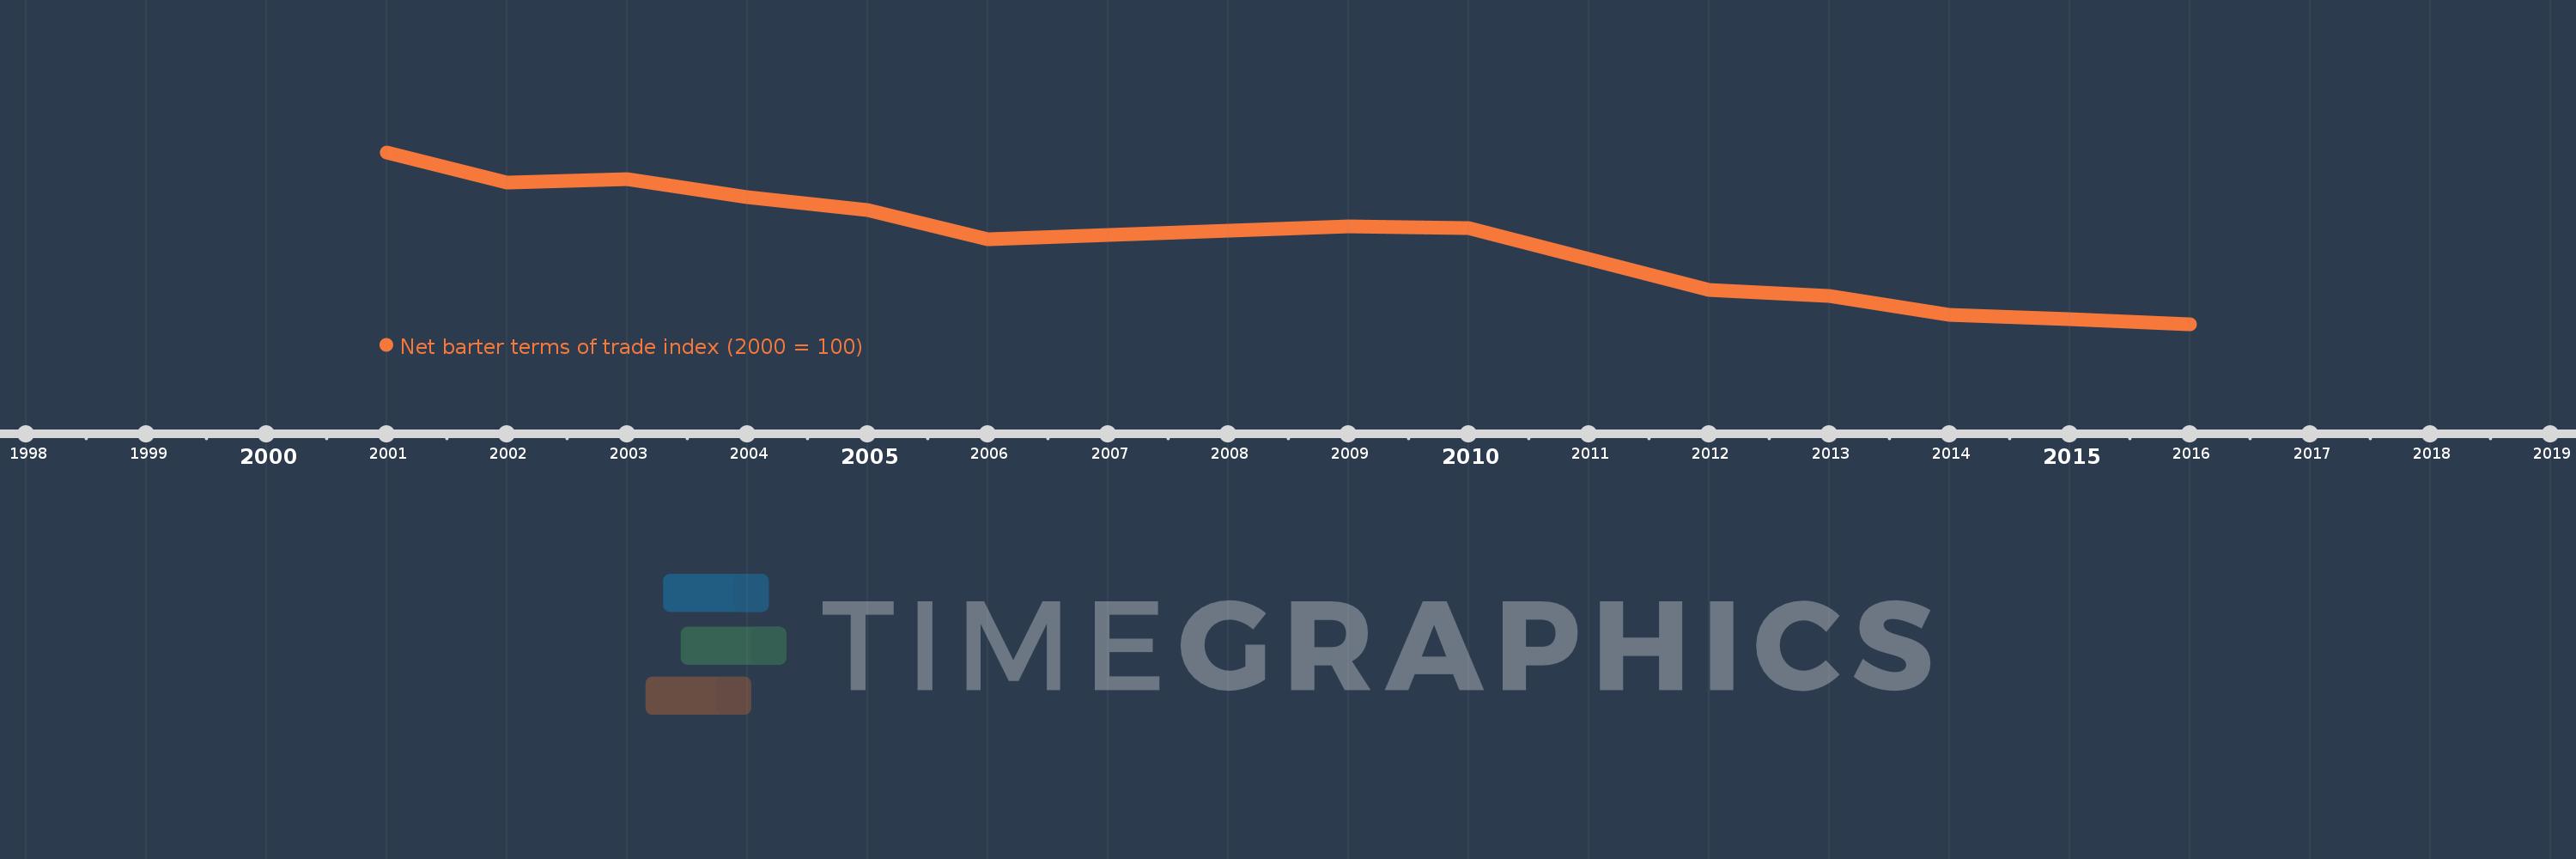
This timeline shows a graph from 2001 to 2016 of Antigua and Barbuda. No data until 2000. Number of actual observations by date: 16.
Source name:
World Development Indicators
Source organization:
United Nations Conference on Trade and Development, Handbook of Statistics and data files, and International Monetary Fund, International Financial Statistics.
Categories, topics:
Private Sector, Trade
Last updated:
apr 23, 2017
Indicators value changes by year
Meaning:
76.569
Minimum:
55.446
jan 1, 2016
Maximum:
100.0
jan 1, 2001
At the date of observation
Value
Absolute change
Change from the previous value
jan 1, 2001
100.0
+100.0
0.0%
jan 1, 2002
92.138
-7.862
-7.86%
jan 1, 2003
93.144
+1.006
1.09%
jan 1, 2004
88.486
-4.658
-5.0%
jan 1, 2005
85.073
-3.412
-3.86%
jan 1, 2006
77.435
-7.639
-8.98%
jan 1, 2007
78.487
+1.052
1.36%
jan 1, 2008
79.735
+1.248
1.59%
jan 1, 2009
80.743
+1.008
1.26%
jan 1, 2010
80.303
-0.439
-0.54%
jan 1, 2011
72.339
-7.964
-9.92%
jan 1, 2012
64.39
-7.949
-10.99%
jan 1, 2013
62.757
-1.634
-2.54%
jan 1, 2014
57.851
-4.905
-7.82%
jan 1, 2015
56.775
-1.076
-1.86%
jan 1, 2016
55.446
-1.33
-2.34%
Ranking of countries by current statistics by years
