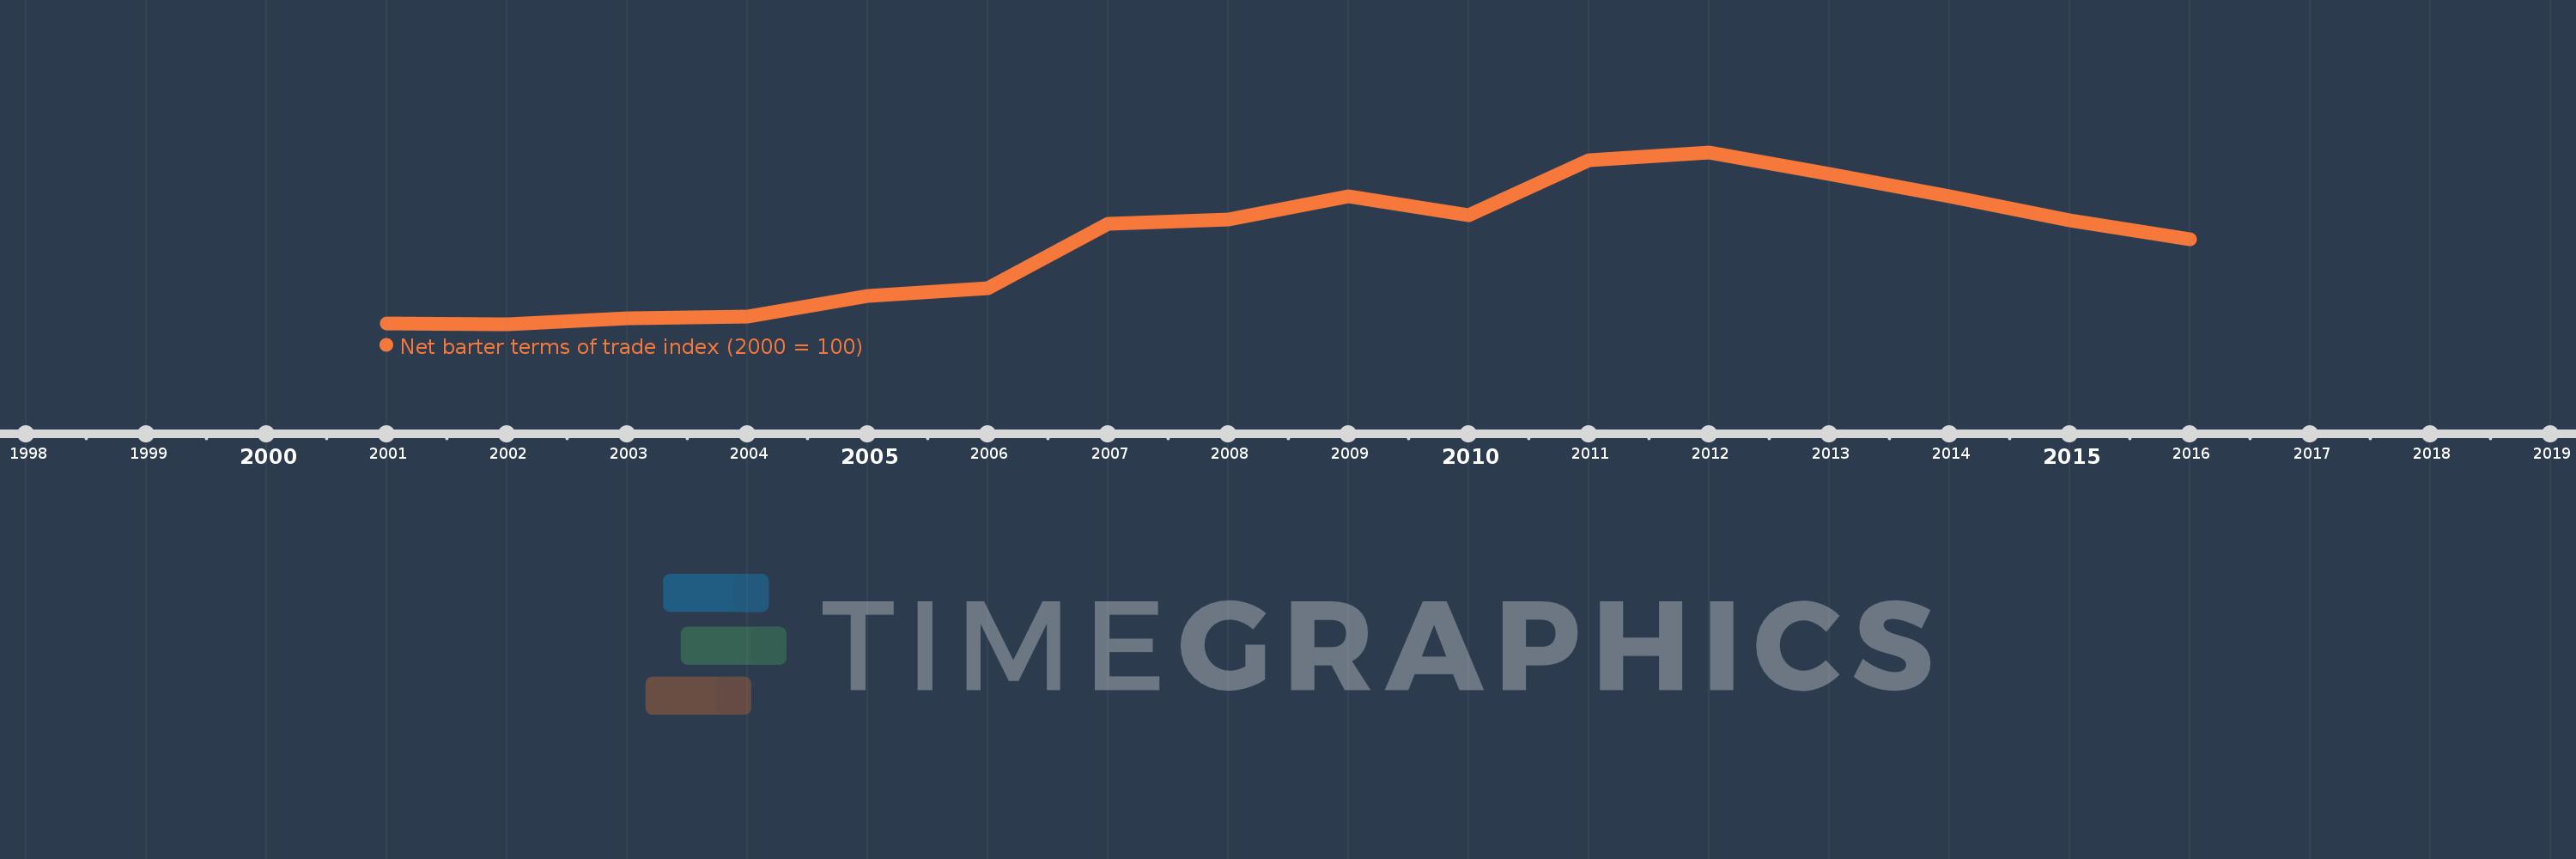
This timeline shows a graph from 2001 to 2016 of Mongolia. No data until 2000. Number of actual observations by date: 16.
Source name:
World Development Indicators
Source organization:
United Nations Conference on Trade and Development, Handbook of Statistics and data files, and International Monetary Fund, International Financial Statistics.
Categories, topics:
Private Sector, Trade
Last updated:
apr 23, 2017
Indicators value changes by year
Meaning:
157.476
Minimum:
99.371
jan 1, 2002
Maximum:
220.0
jan 1, 2012
At the date of observation
Value
Absolute change
Change from the previous value
jan 1, 2001
100.0
+100.0
0.0%
jan 1, 2002
99.371
-0.629
-0.63%
jan 1, 2003
103.491
+4.12
4.15%
jan 1, 2004
104.501
+1.01
0.98%
jan 1, 2005
119.285
+14.784
14.15%
jan 1, 2006
124.705
+5.42
4.54%
jan 1, 2007
170.067
+45.362
36.38%
jan 1, 2008
172.686
+2.619
1.54%
jan 1, 2009
189.023
+16.336
9.46%
jan 1, 2010
176.138
-12.885
-6.82%
jan 1, 2011
214.666
+38.528
21.87%
jan 1, 2012
220.0
+5.334
2.48%
jan 1, 2013
204.827
-15.173
-6.9%
jan 1, 2014
189.178
-15.648
-7.64%
jan 1, 2015
172.498
-16.68
-8.82%
jan 1, 2016
159.18
-13.317
-7.72%
Ranking of countries by current statistics by years
