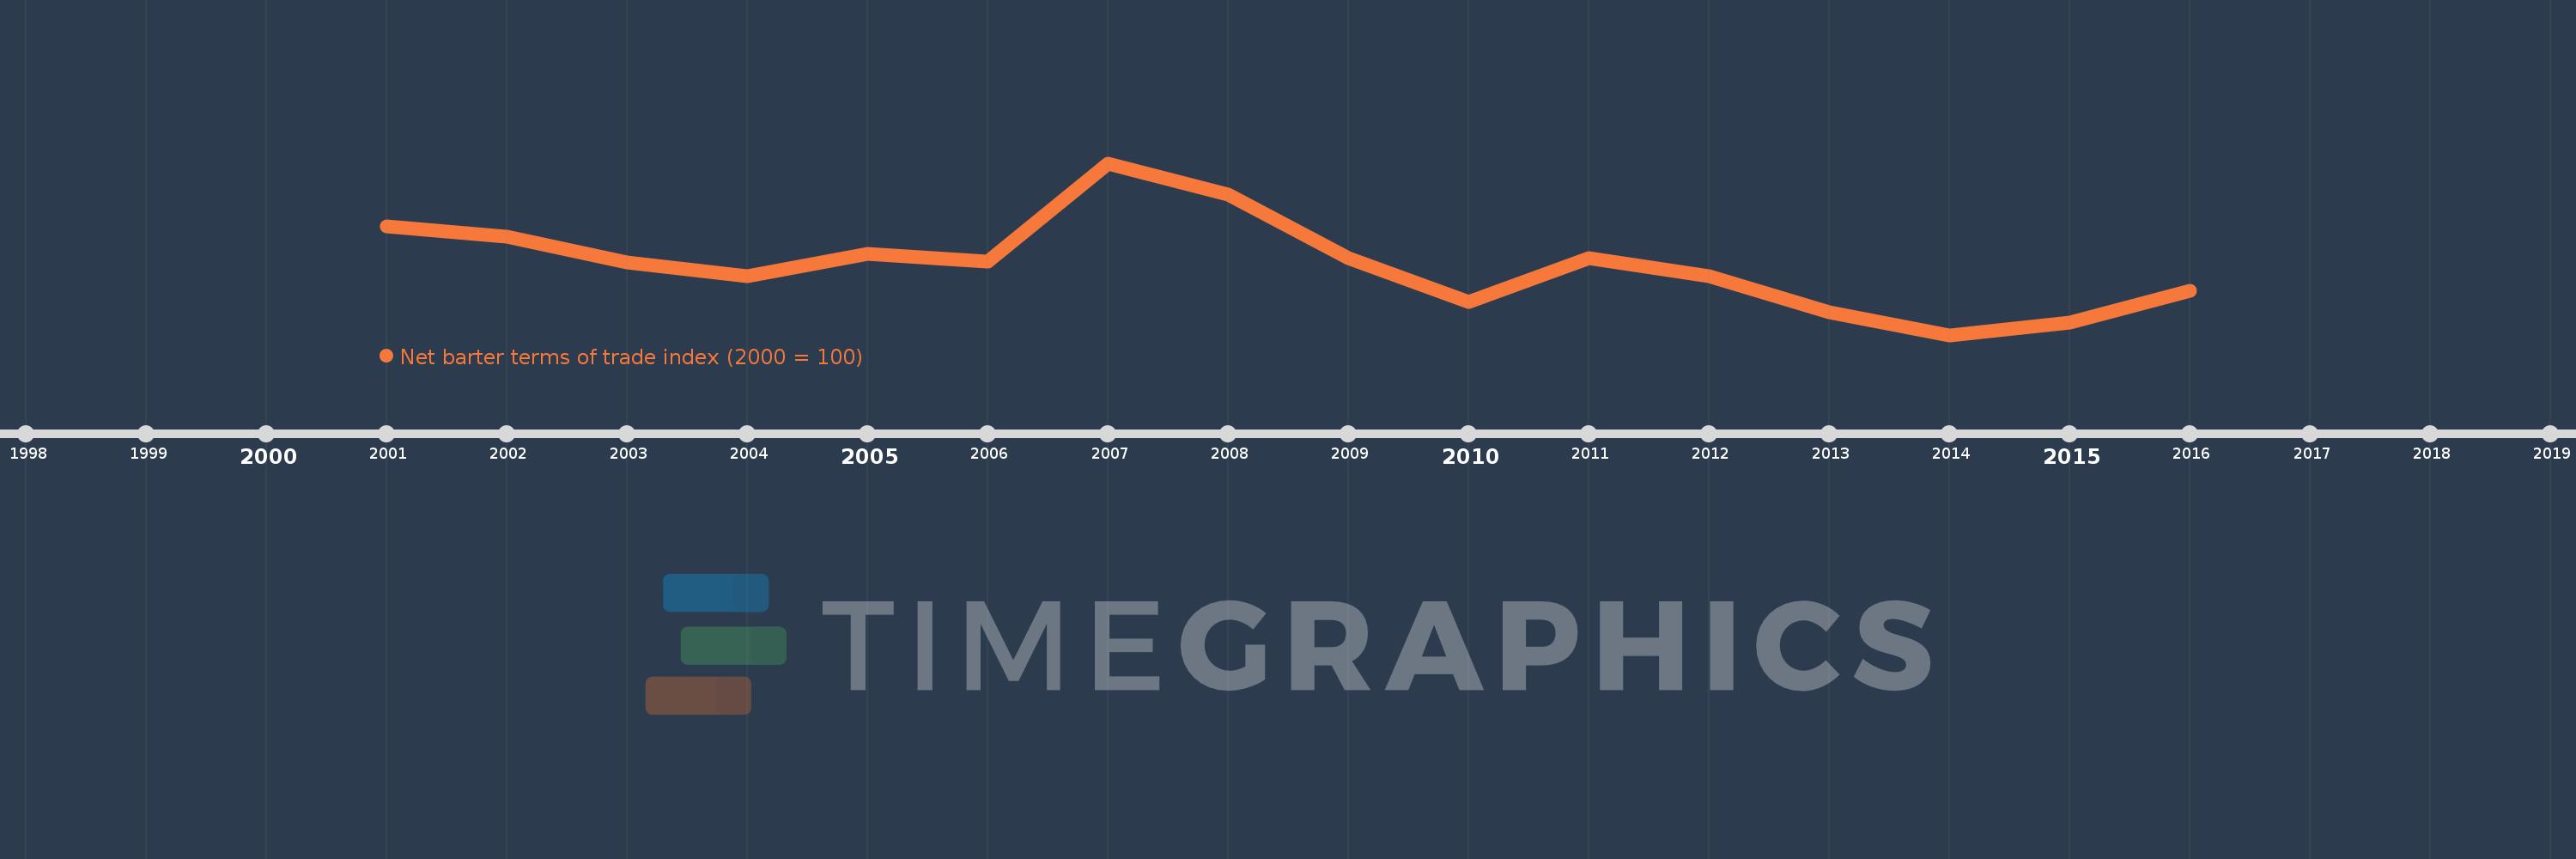
This timeline shows a graph from 2001 to 2016 of Jamaica. No data until 2000. Number of actual observations by date: 16.
Source name:
World Development Indicators
Source organization:
United Nations Conference on Trade and Development, Handbook of Statistics and data files, and International Monetary Fund, International Financial Statistics.
Categories, topics:
Private Sector, Trade
Last updated:
apr 23, 2017
Indicators value changes by year
Meaning:
93.959
Minimum:
82.665
jan 1, 2014
Maximum:
110.149
jan 1, 2007
At the date of observation
Value
Absolute change
Change from the previous value
jan 1, 2001
100.0
+100.0
0.0%
jan 1, 2002
98.463
-1.537
-1.54%
jan 1, 2003
94.258
-4.205
-4.27%
jan 1, 2004
92.092
-2.166
-2.3%
jan 1, 2005
95.679
+3.587
3.89%
jan 1, 2006
94.385
-1.294
-1.35%
jan 1, 2007
110.149
+15.764
16.7%
jan 1, 2008
105.069
-5.08
-4.61%
jan 1, 2009
95.029
-10.04
-9.56%
jan 1, 2010
87.9
-7.128
-7.5%
jan 1, 2011
94.961
+7.061
8.03%
jan 1, 2012
92.061
-2.9
-3.05%
jan 1, 2013
86.322
-5.739
-6.23%
jan 1, 2014
82.665
-3.657
-4.24%
jan 1, 2015
84.627
+1.962
2.37%
jan 1, 2016
89.677
+5.049
5.97%
Ranking of countries by current statistics by years
