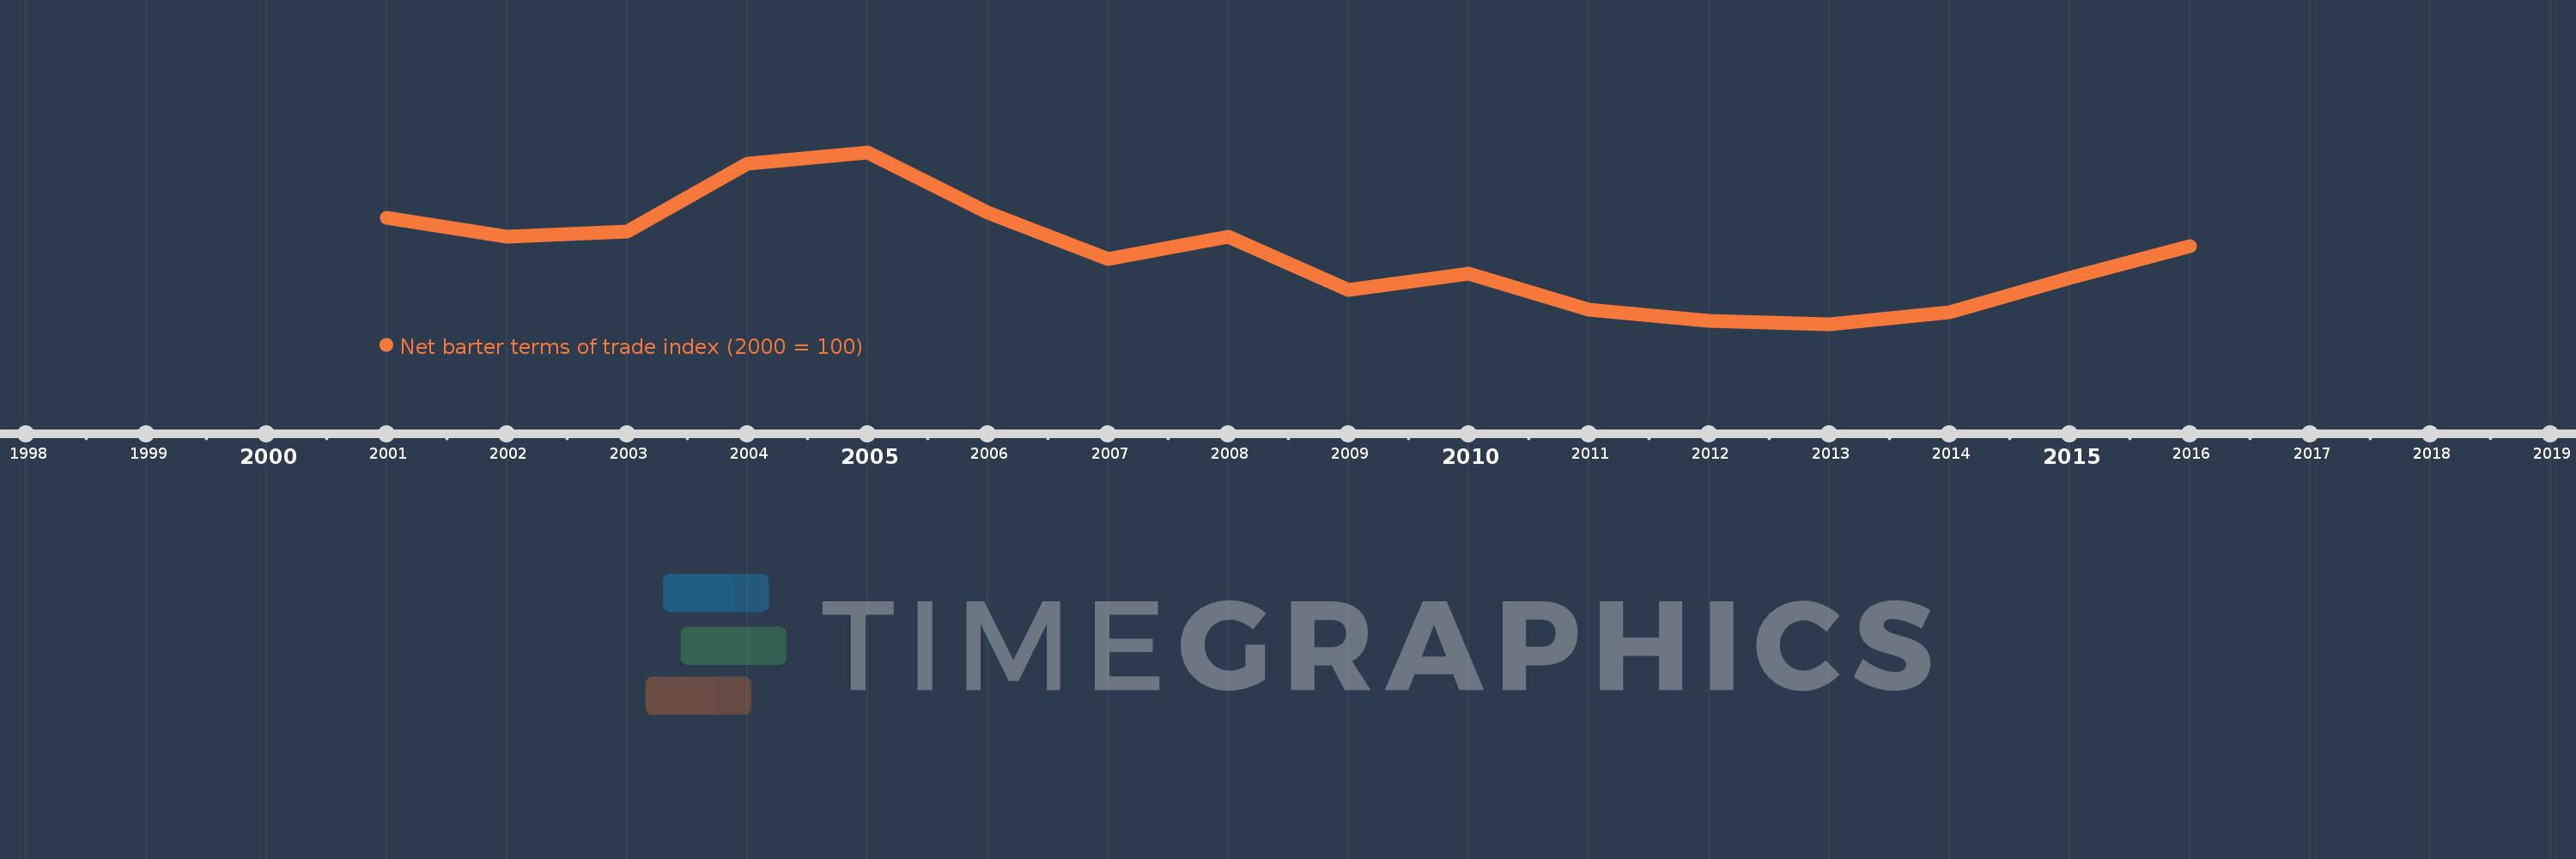
This timeline shows a graph from 2001 to 2016 of Lithuania. No data until 2000. Number of actual observations by date: 16.
Source name:
World Development Indicators
Source organization:
United Nations Conference on Trade and Development, Handbook of Statistics and data files, and International Monetary Fund, International Financial Statistics.
Categories, topics:
Private Sector, Trade
Last updated:
apr 23, 2017
Indicators value changes by year
Meaning:
97.801
Minimum:
93.583
jan 1, 2013
Maximum:
103.916
jan 1, 2005
At the date of observation
Value
Absolute change
Change from the previous value
jan 1, 2001
100.0
+100.0
0.0%
jan 1, 2002
98.855
-1.145
-1.14%
jan 1, 2003
99.154
+0.298
0.3%
jan 1, 2004
103.239
+4.086
4.12%
jan 1, 2005
103.916
+0.676
0.65%
jan 1, 2006
100.309
-3.607
-3.47%
jan 1, 2007
97.527
-2.782
-2.77%
jan 1, 2008
98.832
+1.306
1.34%
jan 1, 2009
95.646
-3.187
-3.22%
jan 1, 2010
96.613
+0.967
1.01%
jan 1, 2011
94.444
-2.169
-2.24%
jan 1, 2012
93.783
-0.661
-0.7%
jan 1, 2013
93.583
-0.2
-0.21%
jan 1, 2014
94.285
+0.702
0.75%
jan 1, 2015
96.363
+2.078
2.2%
jan 1, 2016
98.265
+1.902
1.97%
Ranking of countries by current statistics by years
