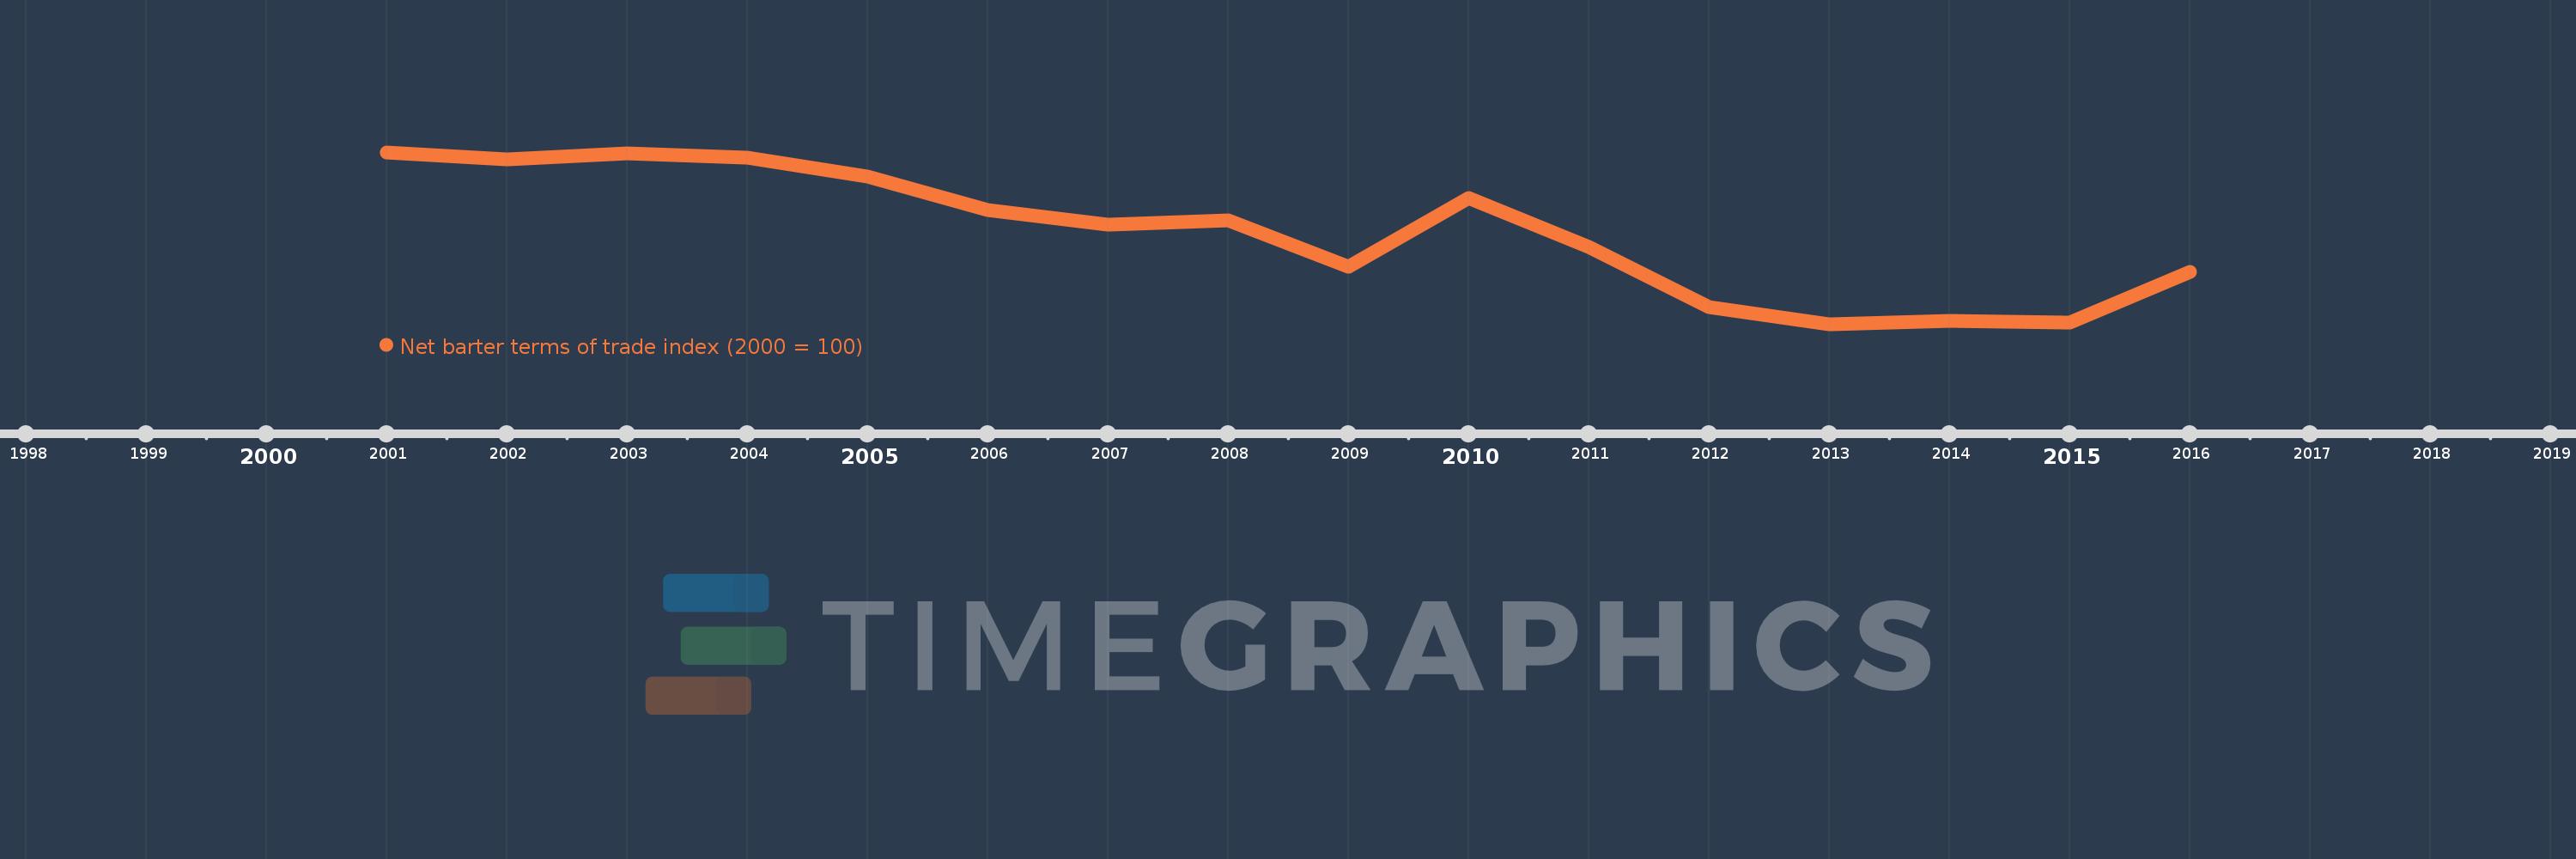
This timeline shows a graph from 2001 to 2016 of Spain. No data until 2000. Number of actual observations by date: 16.
Source name:
World Development Indicators
Source organization:
United Nations Conference on Trade and Development, Handbook of Statistics and data files, and International Monetary Fund, International Financial Statistics.
Categories, topics:
Private Sector, Trade
Last updated:
apr 23, 2017
Indicators value changes by year
Meaning:
94.826
Minimum:
88.847
jan 1, 2013
Maximum:
100.0
jan 1, 2001
At the date of observation
Value
Absolute change
Change from the previous value
jan 1, 2001
100.0
+100.0
0.0%
jan 1, 2002
99.529
-0.471
-0.47%
jan 1, 2003
99.913
+0.384
0.39%
jan 1, 2004
99.657
-0.257
-0.26%
jan 1, 2005
98.409
-1.248
-1.25%
jan 1, 2006
96.271
-2.138
-2.17%
jan 1, 2007
95.315
-0.956
-0.99%
jan 1, 2008
95.565
+0.25
0.26%
jan 1, 2009
92.566
-2.999
-3.14%
jan 1, 2010
97.046
+4.48
4.84%
jan 1, 2011
93.873
-3.173
-3.27%
jan 1, 2012
89.958
-3.915
-4.17%
jan 1, 2013
88.847
-1.111
-1.24%
jan 1, 2014
89.088
+0.242
0.27%
jan 1, 2015
88.941
-0.147
-0.17%
jan 1, 2016
92.232
+3.291
3.7%
Ranking of countries by current statistics by years
