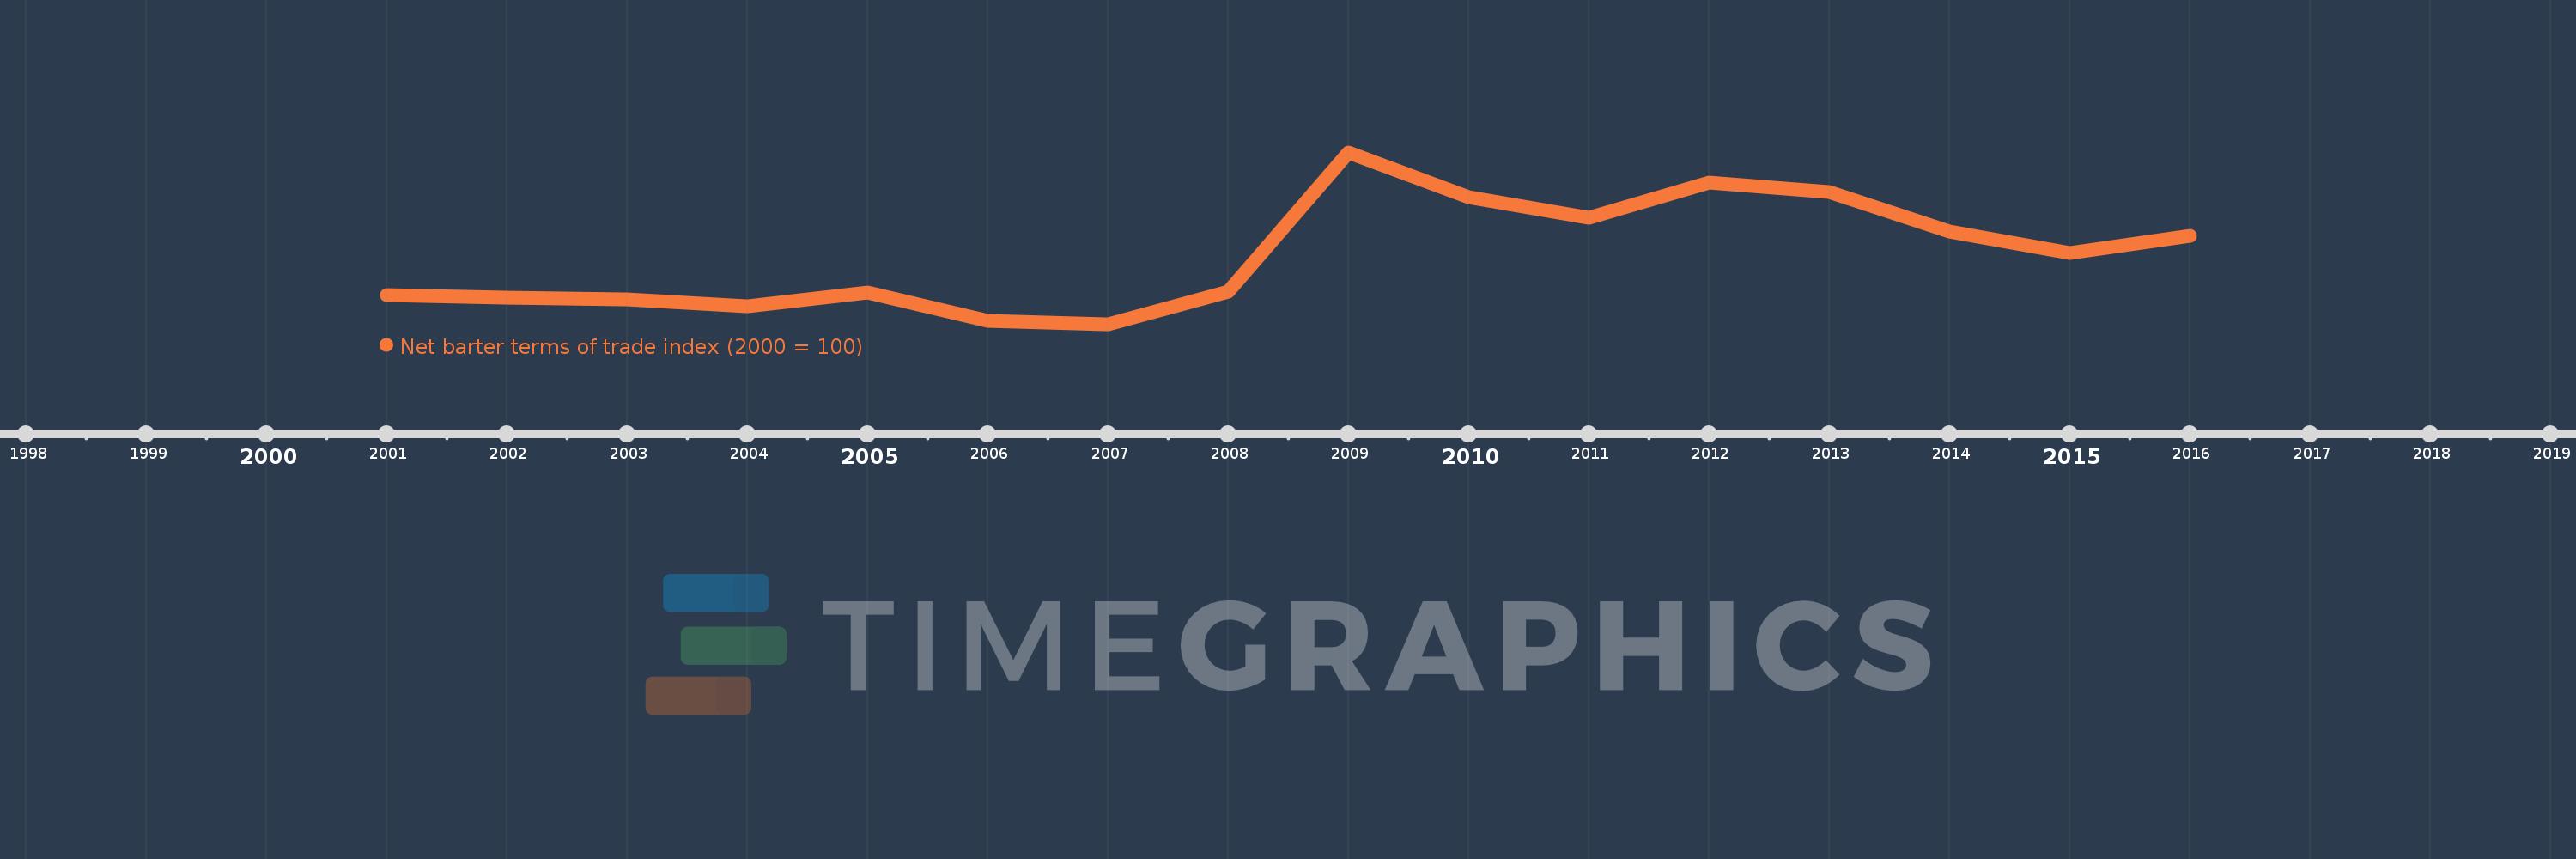
This timeline shows a graph from 2001 to 2016 of Nauru. No data until 2000. Number of actual observations by date: 16.
Source name:
World Development Indicators
Source organization:
United Nations Conference on Trade and Development, Handbook of Statistics and data files, and International Monetary Fund, International Financial Statistics.
Categories, topics:
Private Sector, Trade
Last updated:
apr 23, 2017
Indicators value changes by year
Meaning:
127.886
Minimum:
79.088
jan 1, 2007
Maximum:
201.185
jan 1, 2009
At the date of observation
Value
Absolute change
Change from the previous value
jan 1, 2001
100.0
+100.0
0.0%
jan 1, 2002
98.173
-1.827
-1.83%
jan 1, 2003
96.5
-1.672
-1.7%
jan 1, 2004
91.961
-4.539
-4.7%
jan 1, 2005
101.596
+9.635
10.48%
jan 1, 2006
81.324
-20.272
-19.95%
jan 1, 2007
79.088
-2.236
-2.75%
jan 1, 2008
102.375
+23.287
29.44%
jan 1, 2009
201.185
+98.81
96.52%
jan 1, 2010
169.358
-31.828
-15.82%
jan 1, 2011
155.031
-14.327
-8.46%
jan 1, 2012
179.604
+24.573
15.85%
jan 1, 2013
173.145
-6.459
-3.6%
jan 1, 2014
144.69
-28.455
-16.43%
jan 1, 2015
129.99
-14.7
-10.16%
jan 1, 2016
142.149
+12.158
9.35%
Ranking of countries by current statistics by years
