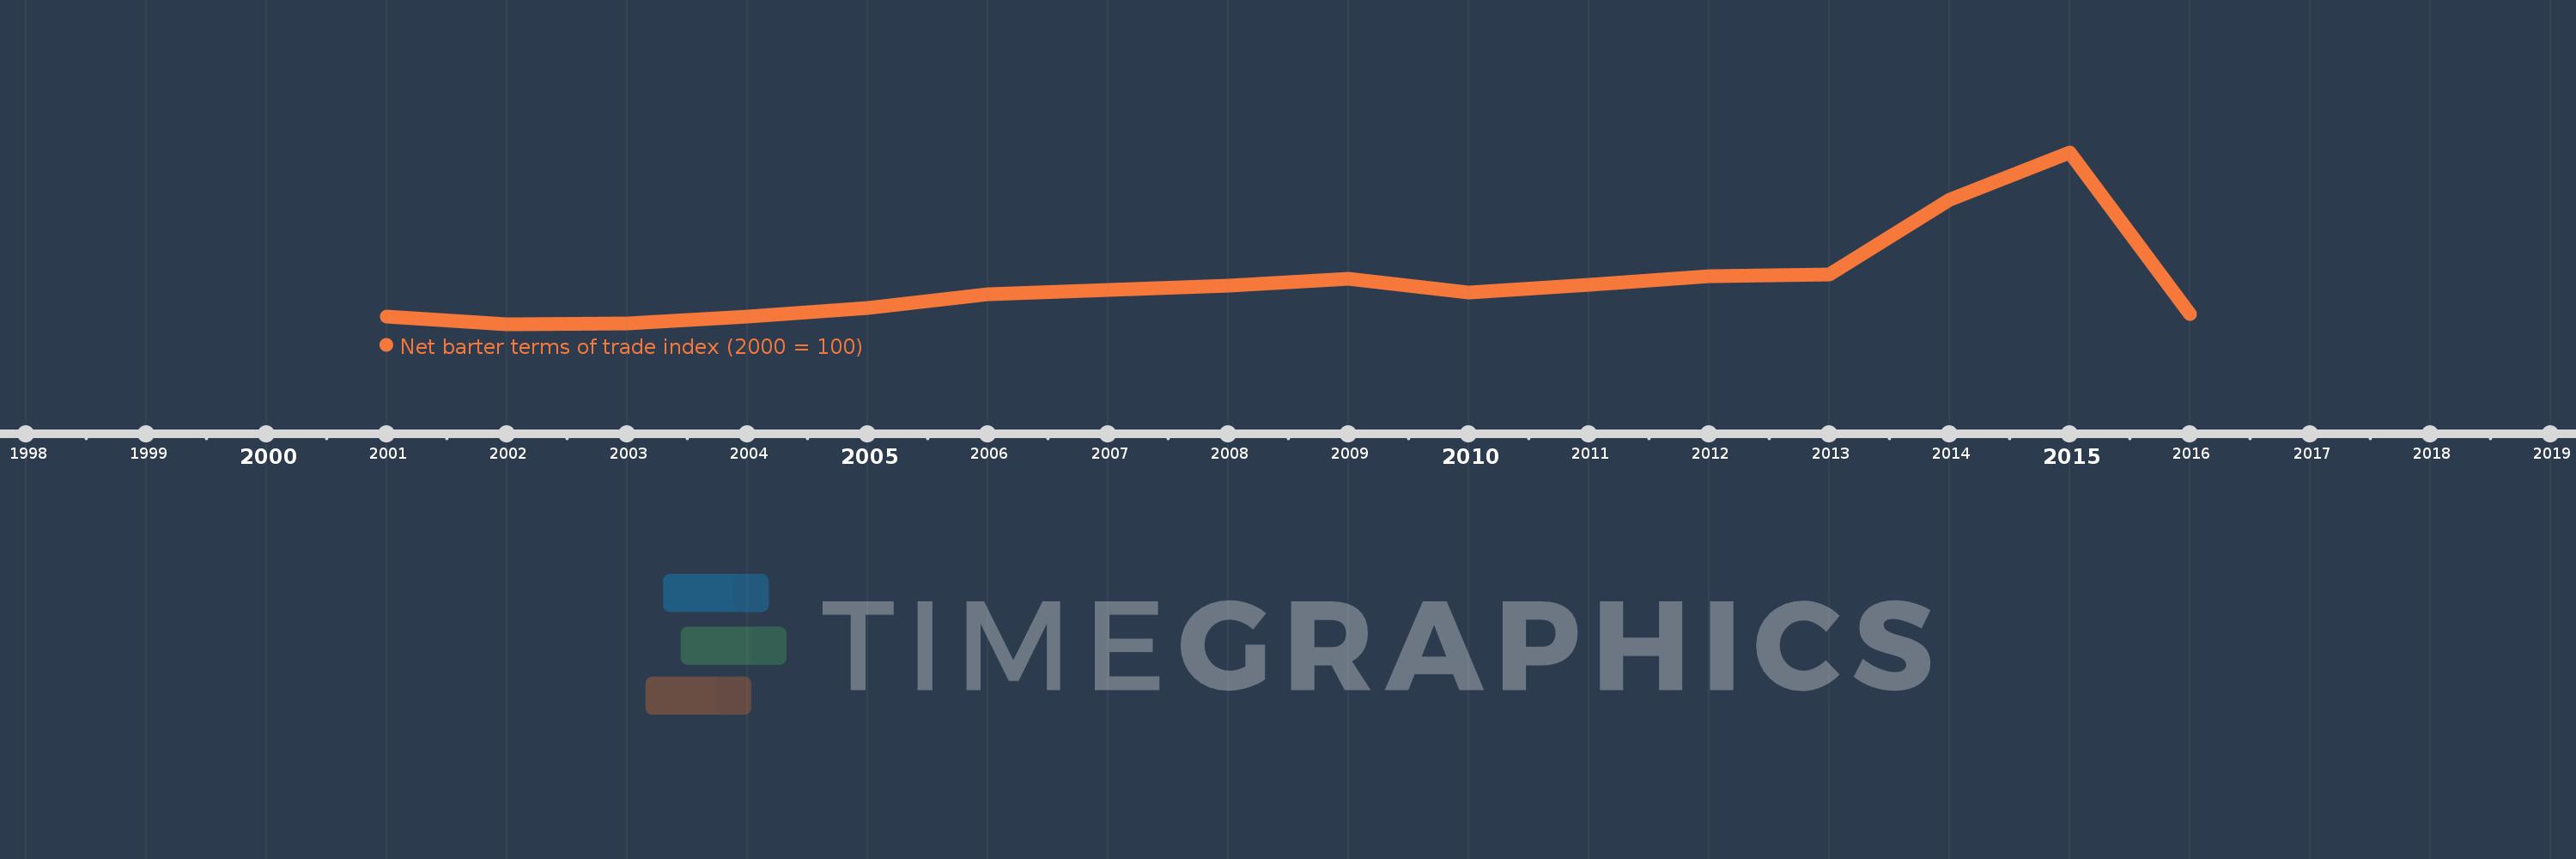
This timeline shows a graph from 2001 to 2016 of Syrian Arab Republic. No data until 2000. Number of actual observations by date: 16.
Source name:
World Development Indicators
Source organization:
United Nations Conference on Trade and Development, Handbook of Statistics and data files, and International Monetary Fund, International Financial Statistics.
Categories, topics:
Private Sector, Trade
Last updated:
apr 23, 2017
Indicators value changes by year
Meaning:
131.363
Minimum:
92.837
jan 1, 2002
Maximum:
254.846
jan 1, 2015
At the date of observation
Value
Absolute change
Change from the previous value
jan 1, 2001
100.0
+100.0
0.0%
jan 1, 2002
92.837
-7.163
-7.16%
jan 1, 2003
93.76
+0.923
0.99%
jan 1, 2004
99.666
+5.905
6.3%
jan 1, 2005
108.311
+8.645
8.67%
jan 1, 2006
120.731
+12.421
11.47%
jan 1, 2007
125.205
+4.474
3.71%
jan 1, 2008
129.165
+3.96
3.16%
jan 1, 2009
135.332
+6.166
4.77%
jan 1, 2010
122.654
-12.678
-9.37%
jan 1, 2011
129.763
+7.11
5.8%
jan 1, 2012
137.982
+8.219
6.33%
jan 1, 2013
139.343
+1.361
0.99%
jan 1, 2014
209.841
+70.497
50.59%
jan 1, 2015
254.846
+45.005
21.45%
jan 1, 2016
102.376
-152.47
-59.83%
Ranking of countries by current statistics by years
