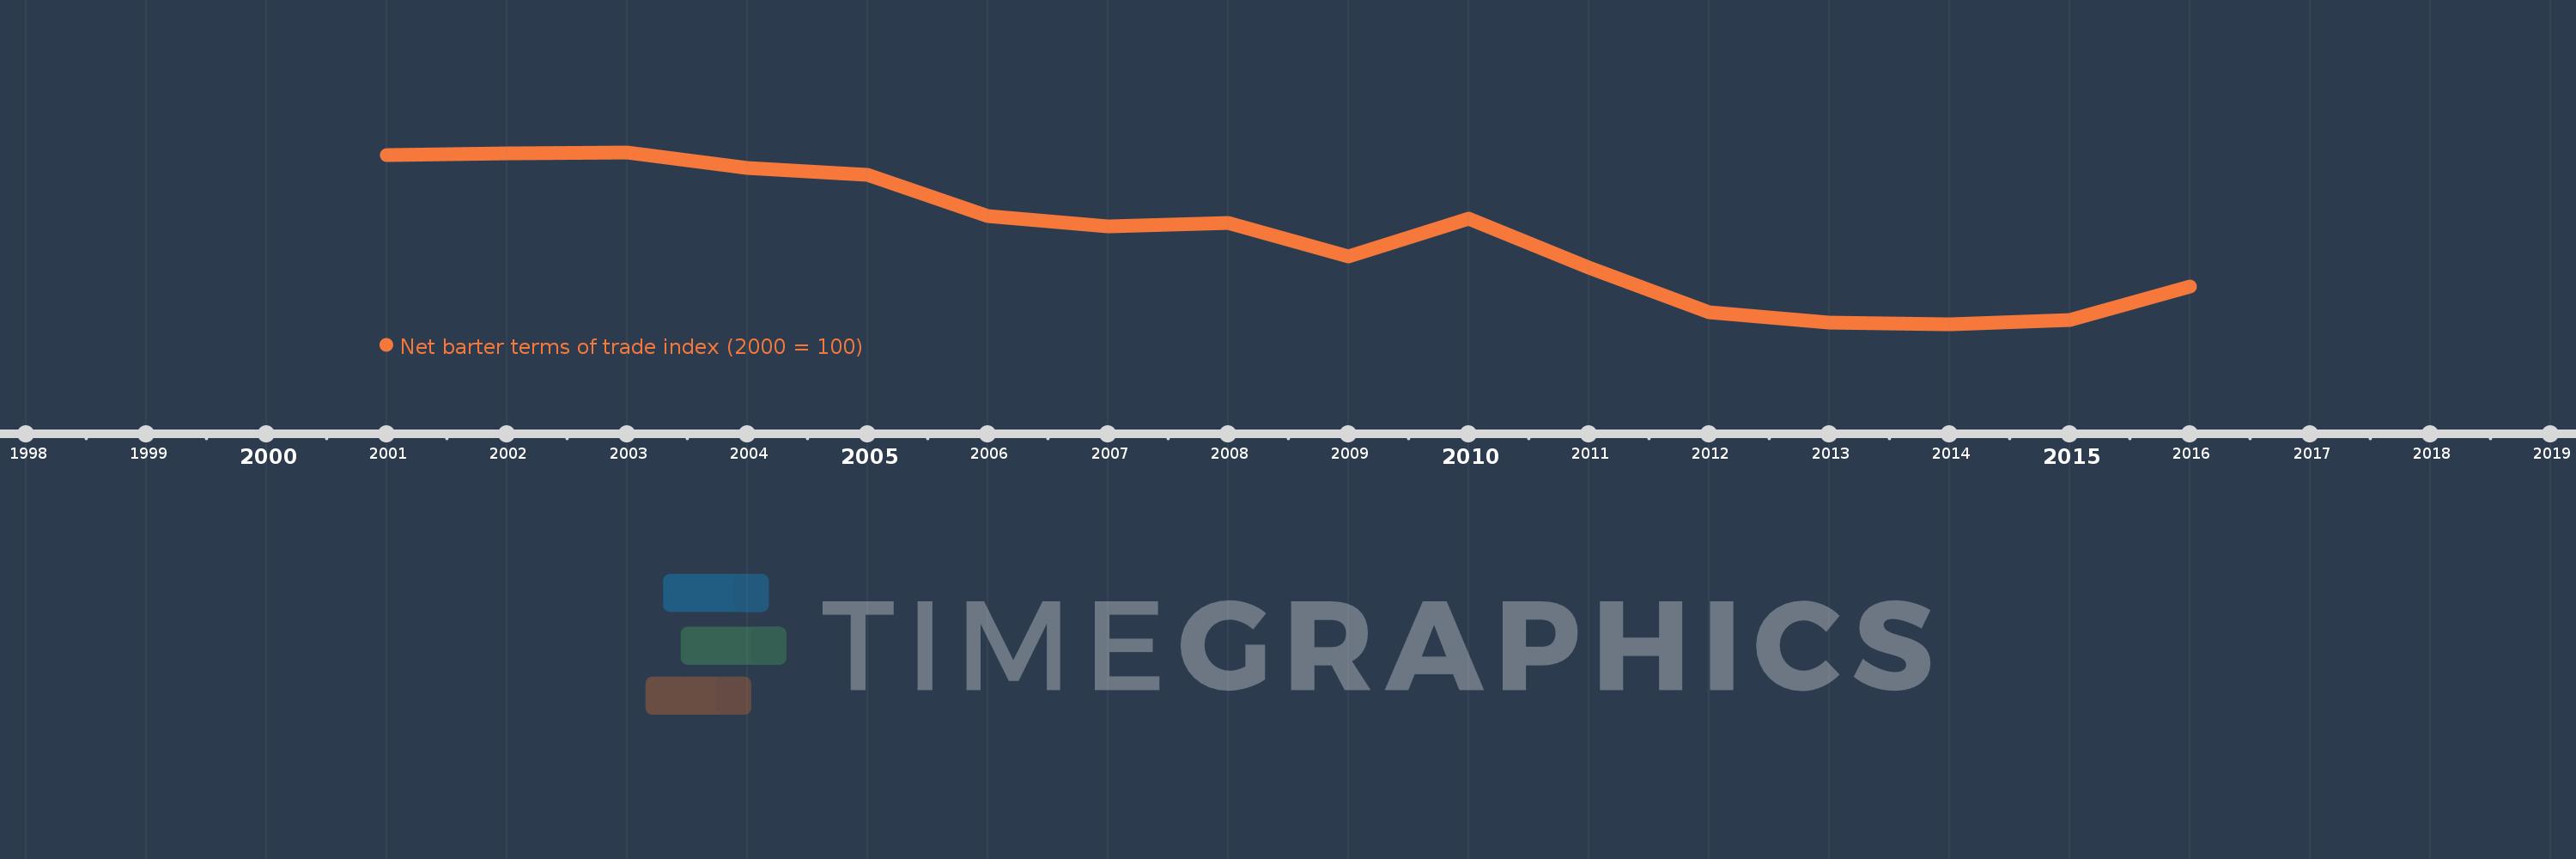
This timeline shows a graph from 2001 to 2016 of France. No data until 2000. Number of actual observations by date: 16.
Source name:
World Development Indicators
Source organization:
United Nations Conference on Trade and Development, Handbook of Statistics and data files, and International Monetary Fund, International Financial Statistics.
Categories, topics:
Private Sector, Trade
Last updated:
apr 23, 2017
Indicators value changes by year
Meaning:
94.618
Minimum:
88.764
jan 1, 2014
Maximum:
100.179
jan 1, 2003
At the date of observation
Value
Absolute change
Change from the previous value
jan 1, 2001
100.0
+100.0
0.0%
jan 1, 2002
100.092
+0.092
0.09%
jan 1, 2003
100.179
+0.088
0.09%
jan 1, 2004
99.166
-1.014
-1.01%
jan 1, 2005
98.69
-0.476
-0.48%
jan 1, 2006
95.97
-2.719
-2.76%
jan 1, 2007
95.287
-0.683
-0.71%
jan 1, 2008
95.5
+0.213
0.22%
jan 1, 2009
93.252
-2.248
-2.35%
jan 1, 2010
95.772
+2.52
2.7%
jan 1, 2011
92.5
-3.272
-3.42%
jan 1, 2012
89.533
-2.967
-3.21%
jan 1, 2013
88.849
-0.684
-0.76%
jan 1, 2014
88.764
-0.084
-0.1%
jan 1, 2015
89.059
+0.295
0.33%
jan 1, 2016
91.269
+2.21
2.48%
Ranking of countries by current statistics by years
