29
/
en
AIzaSyAYiBZKx7MnpbEhh9jyipgxe19OcubqV5w
April 1, 2024
66526
Algeria
DZA
true
2
1
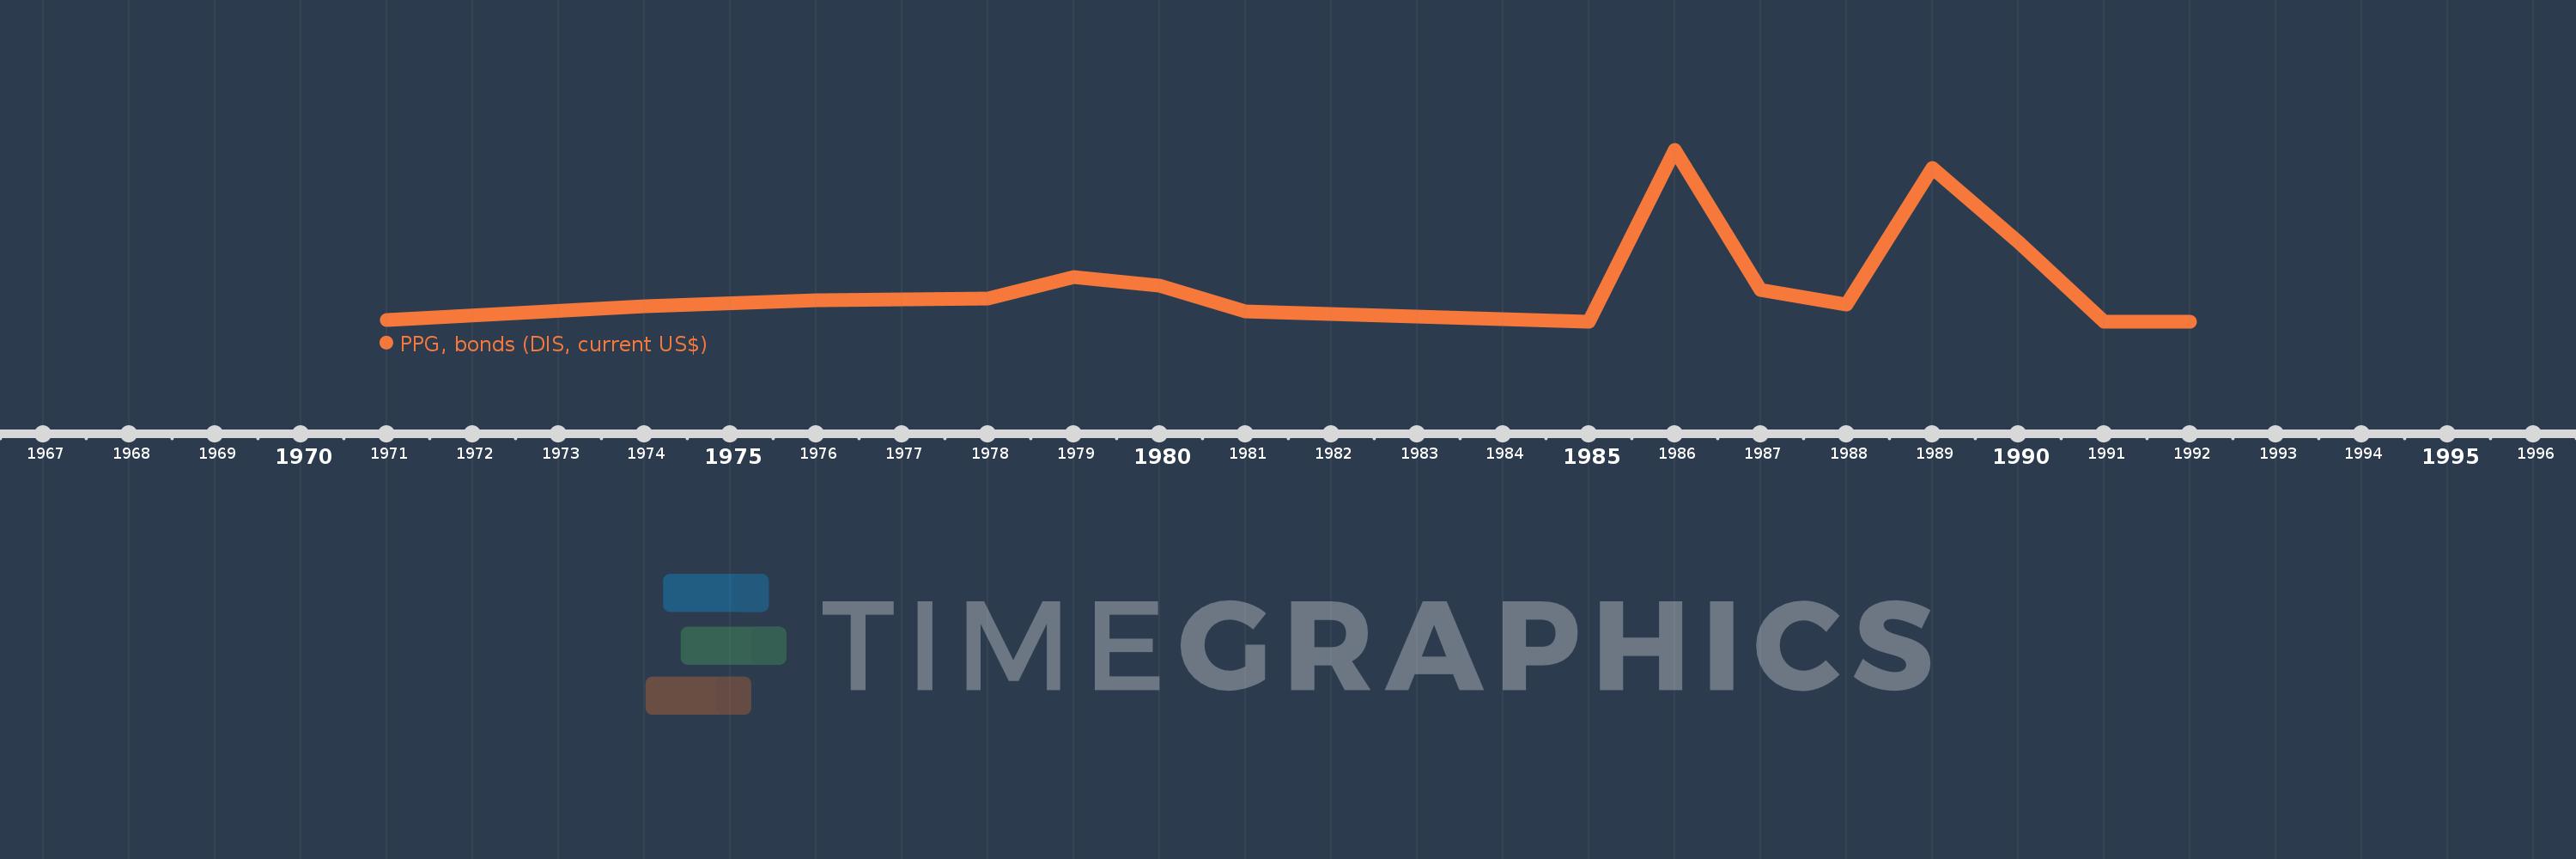
PPG, bonds (DIS, current US$)
1992,1991,1990,1989,1988,1987,1986,1985,1981,1980,1979,1978,1976,1974,1971
This statistics in other country:
Timeline:
This timeline shows a graph from 1971 to 1992 of Algeria. No data until 1970. Number of actual observations by date: 15.
Source name:
World Development Indicators
Source organization:
World Bank, International Debt Statistics.
Categories, topics:
External Debt
Last updated:
apr 23, 2017
Indicators value changes by year
Maximum:
500.0 mln
jan 1, 1986
At the date of observation
Value
Absolute change
Change from previous value
jan 1, 1971
5.037 mln
+5.037 mln
0.0%
jan 1, 1974
44.84 mln
+39.803 mln
790.21%
jan 1, 1976
62.07 mln
+17.23 mln
38.43%
jan 1, 1978
68.106 mln
+6.036 mln
9.72%
jan 1, 1979
130.222 mln
+62.116 mln
91.2%
jan 1, 1980
105.0 mln
-25.222 mln
-19.37%
jan 1, 1981
29.877 mln
-75.123 mln
-71.55%
jan 1, 1985
0.0
-29.877 mln
-100.0%
jan 1, 1986
500.0 mln
+500.0 mln
%
jan 1, 1987
92.512 mln
-407.488 mln
-81.5%
jan 1, 1988
50.01 mln
-42.502 mln
-45.94%
jan 1, 1989
447.475 mln
+397.465 mln
794.77%
jan 1, 1990
232.447 mln
-215.028 mln
-48.05%
jan 1, 1991
175.0K
-232.272 mln
-99.92%
jan 1, 1992
824.0K
+649.0K
370.86%
Ranking of countries by current statistics by years


Comments: