29
/
en
AIzaSyAYiBZKx7MnpbEhh9jyipgxe19OcubqV5w
April 1, 2024
144924
Guatemala
GTM
true
2
1
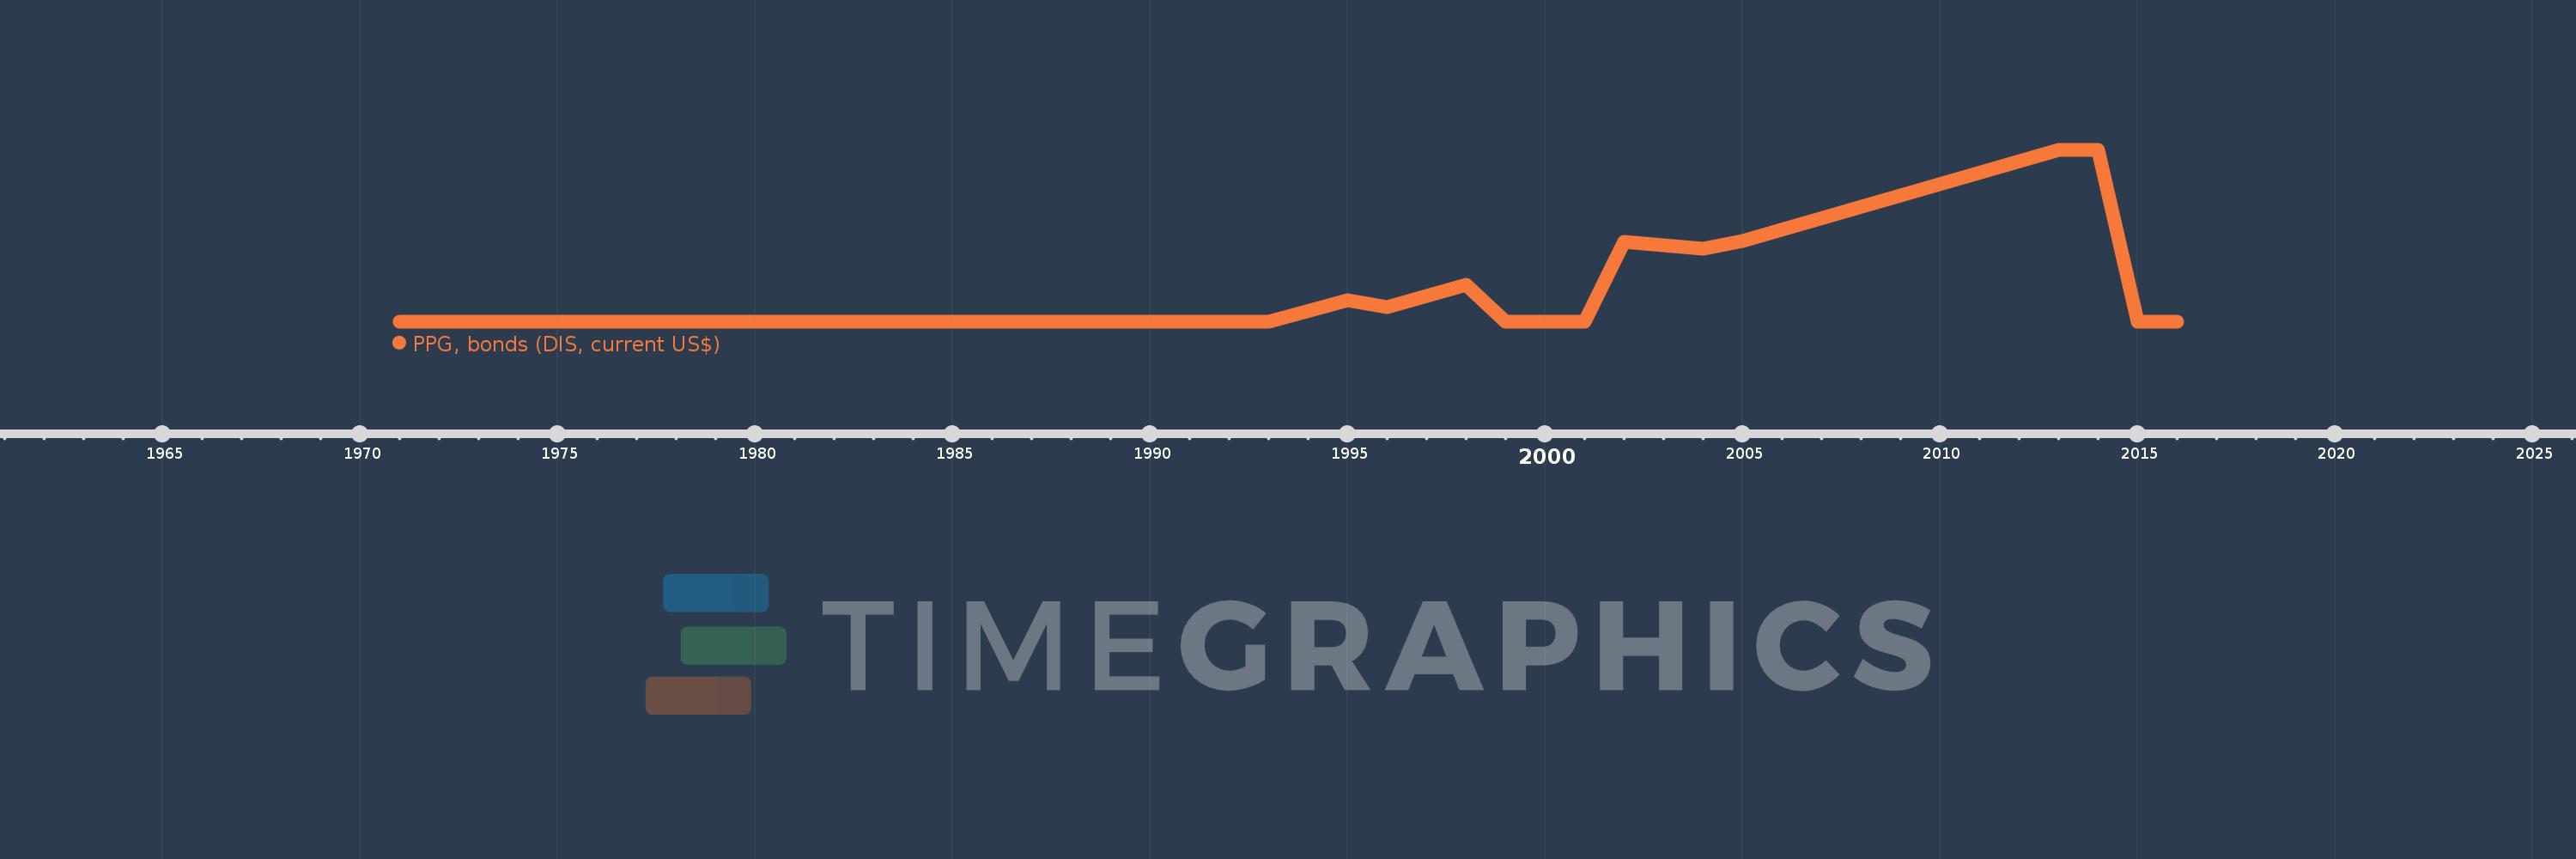
PPG, bonds (DIS, current US$)
2016,2015,2014,2013,2005,2004,2002,2001,2000,1999,1998,1996,1995,1993,1971
This statistics in other country:
Timeline:
This timeline shows a graph from 1971 to 2016 of Guatemala. No data until 1970. Number of actual observations by date: 15.
Source name:
World Development Indicators
Source organization:
World Bank, International Debt Statistics.
Categories, topics:
External Debt
Last updated:
apr 23, 2017
Indicators value changes by year
Maximum:
700.0 mln
jan 1, 2013
At the date of observation
Value
Absolute change
Change from previous value
jan 1, 1971
16.0K
+16.0K
0.0%
jan 1, 1993
1.817 mln
+1.801 mln
11.26K%
jan 1, 1995
88.91 mln
+87.093 mln
4.79K%
jan 1, 1996
59.273 mln
-29.637 mln
-33.33%
jan 1, 1998
150.0 mln
+90.727 mln
153.07%
jan 1, 1999
0.0
-150.0 mln
-100.0%
jan 1, 2002
325.0 mln
+325.0 mln
%
jan 1, 2004
300.0 mln
-25.0 mln
-7.69%
jan 1, 2005
330.0 mln
+30.0 mln
10.0%
jan 1, 2013
700.0 mln
+370.0 mln
112.12%
jan 1, 2014
700.0 mln
0.0
0.0%
jan 1, 2015
0.0
-700.0 mln
-100.0%
Ranking of countries by current statistics by years


Comments: