29
/
en
AIzaSyAYiBZKx7MnpbEhh9jyipgxe19OcubqV5w
April 1, 2024
249270
Sri Lanka
LKA
true
2
1
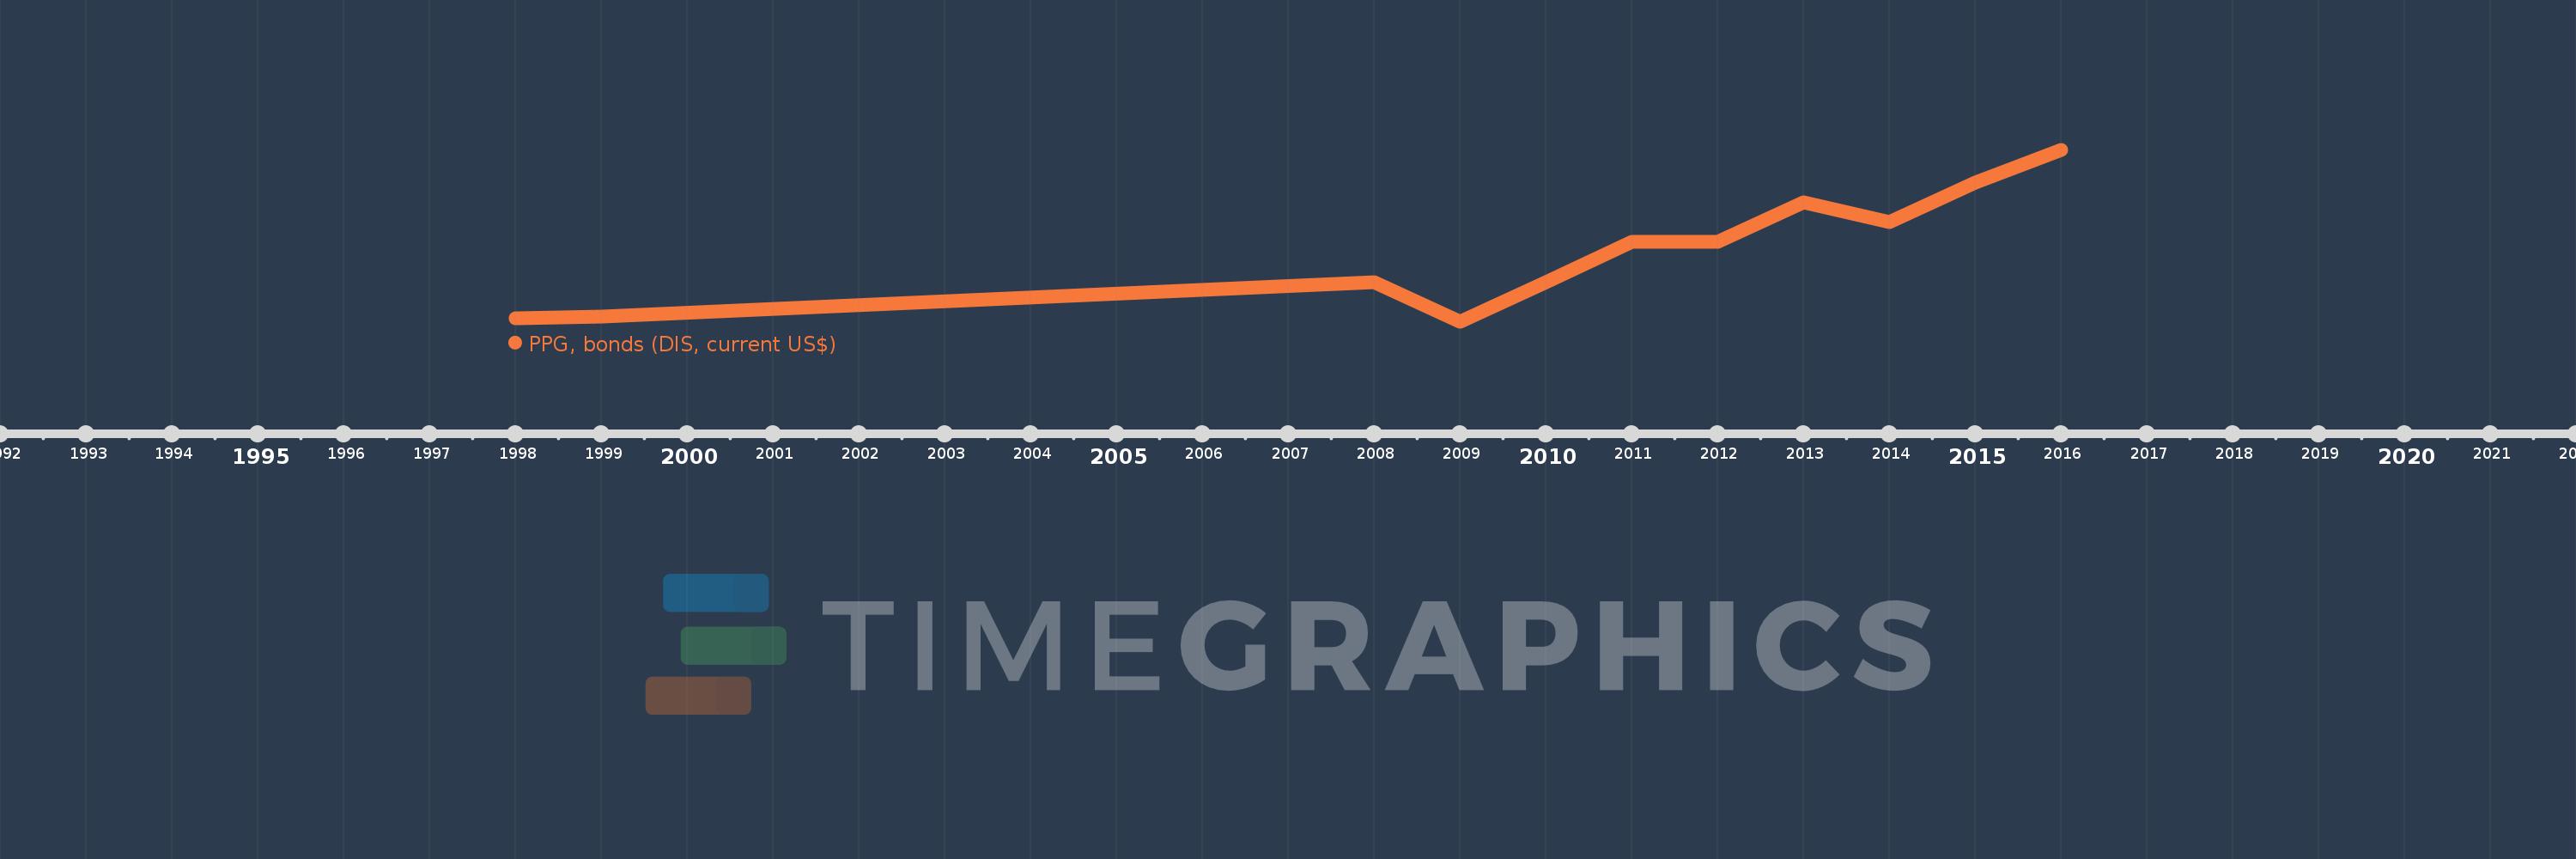
PPG, bonds (DIS, current US$)
2016,2015,2014,2013,2012,2011,2010,2009,2008,1999,1998
This statistics in other country:
Timeline:
This timeline shows a graph from 1998 to 2016 of Sri Lanka. No data until 1997. Number of actual observations by date: 11.
Source name:
World Development Indicators
Source organization:
World Bank, International Debt Statistics.
Categories, topics:
External Debt
Last updated:
apr 23, 2017
Indicators value changes by year
Maximum:
2.15 bln
jan 1, 2016
At the date of observation
Value
Absolute change
Change from previous value
jan 1, 1998
50.0 mln
+50.0 mln
0.0%
jan 1, 1999
65.0 mln
+15.0 mln
30.0%
jan 1, 2008
500.0 mln
+435.0 mln
669.23%
jan 1, 2009
0.0
-500.0 mln
-100.0%
jan 1, 2010
500.0 mln
+500.0 mln
%
jan 1, 2011
1000.0 mln
+500.0 mln
100.0%
jan 1, 2012
1000.0 mln
0.0
0.0%
jan 1, 2013
1.5 bln
+500.0 mln
50.0%
jan 1, 2014
1.25 bln
-250.0 mln
-16.67%
jan 1, 2015
1.75 bln
+500.0 mln
40.0%
jan 1, 2016
2.15 bln
+400.0 mln
22.86%
Ranking of countries by current statistics by years


Comments: