29
/
en
AIzaSyAYiBZKx7MnpbEhh9jyipgxe19OcubqV5w
April 1, 2024
122681
Dominican Republic
DOM
true
2
1
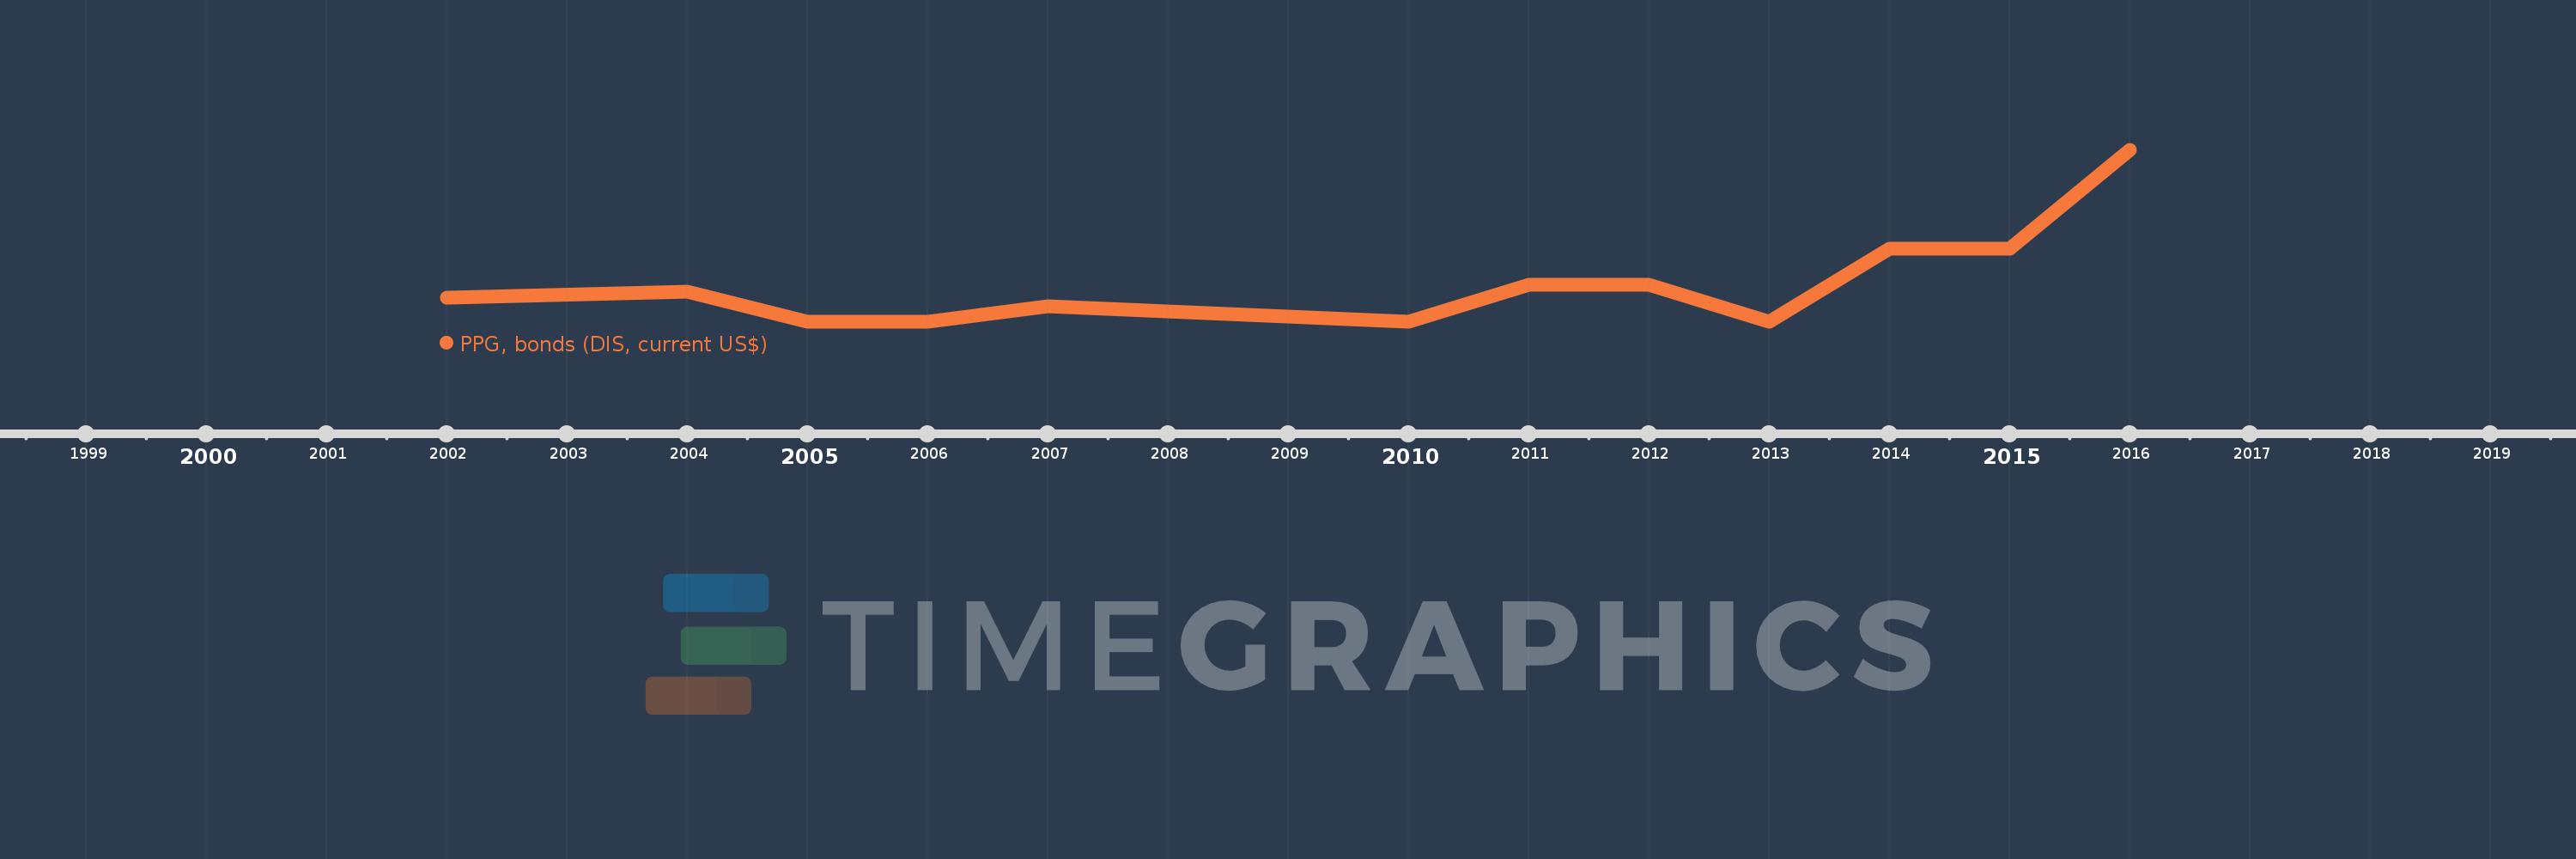
PPG, bonds (DIS, current US$)
2016,2015,2014,2013,2012,2011,2010,2007,2006,2005,2004,2002
This statistics in other country:
Timeline:
This timeline shows a graph from 2002 to 2016 of Dominican Republic. No data until 2001. Number of actual observations by date: 12.
Source name:
World Development Indicators
Source organization:
World Bank, International Debt Statistics.
Categories, topics:
External Debt
Last updated:
apr 23, 2017
Indicators value changes by year
Maximum:
3.5 bln
jan 1, 2016
At the date of observation
Value
Absolute change
Change from previous value
jan 1, 2002
500.0 mln
+500.0 mln
0.0%
jan 1, 2004
613.534 mln
+113.534 mln
22.71%
jan 1, 2005
0.0
-613.534 mln
-100.0%
jan 1, 2007
324.178 mln
+324.178 mln
%
jan 1, 2010
0.0
-324.178 mln
-100.0%
jan 1, 2011
750.0 mln
+750.0 mln
%
jan 1, 2012
750.0 mln
0.0
0.0%
jan 1, 2013
0.0
-750.0 mln
-100.0%
jan 1, 2014
1.5 bln
+1.5 bln
%
jan 1, 2015
1.5 bln
0.0
0.0%
jan 1, 2016
3.5 bln
+2.0 bln
133.33%
Ranking of countries by current statistics by years


Comments: