29
/
en
AIzaSyAYiBZKx7MnpbEhh9jyipgxe19OcubqV5w
April 1, 2024
274121
Ukraine
UKR
true
2
1
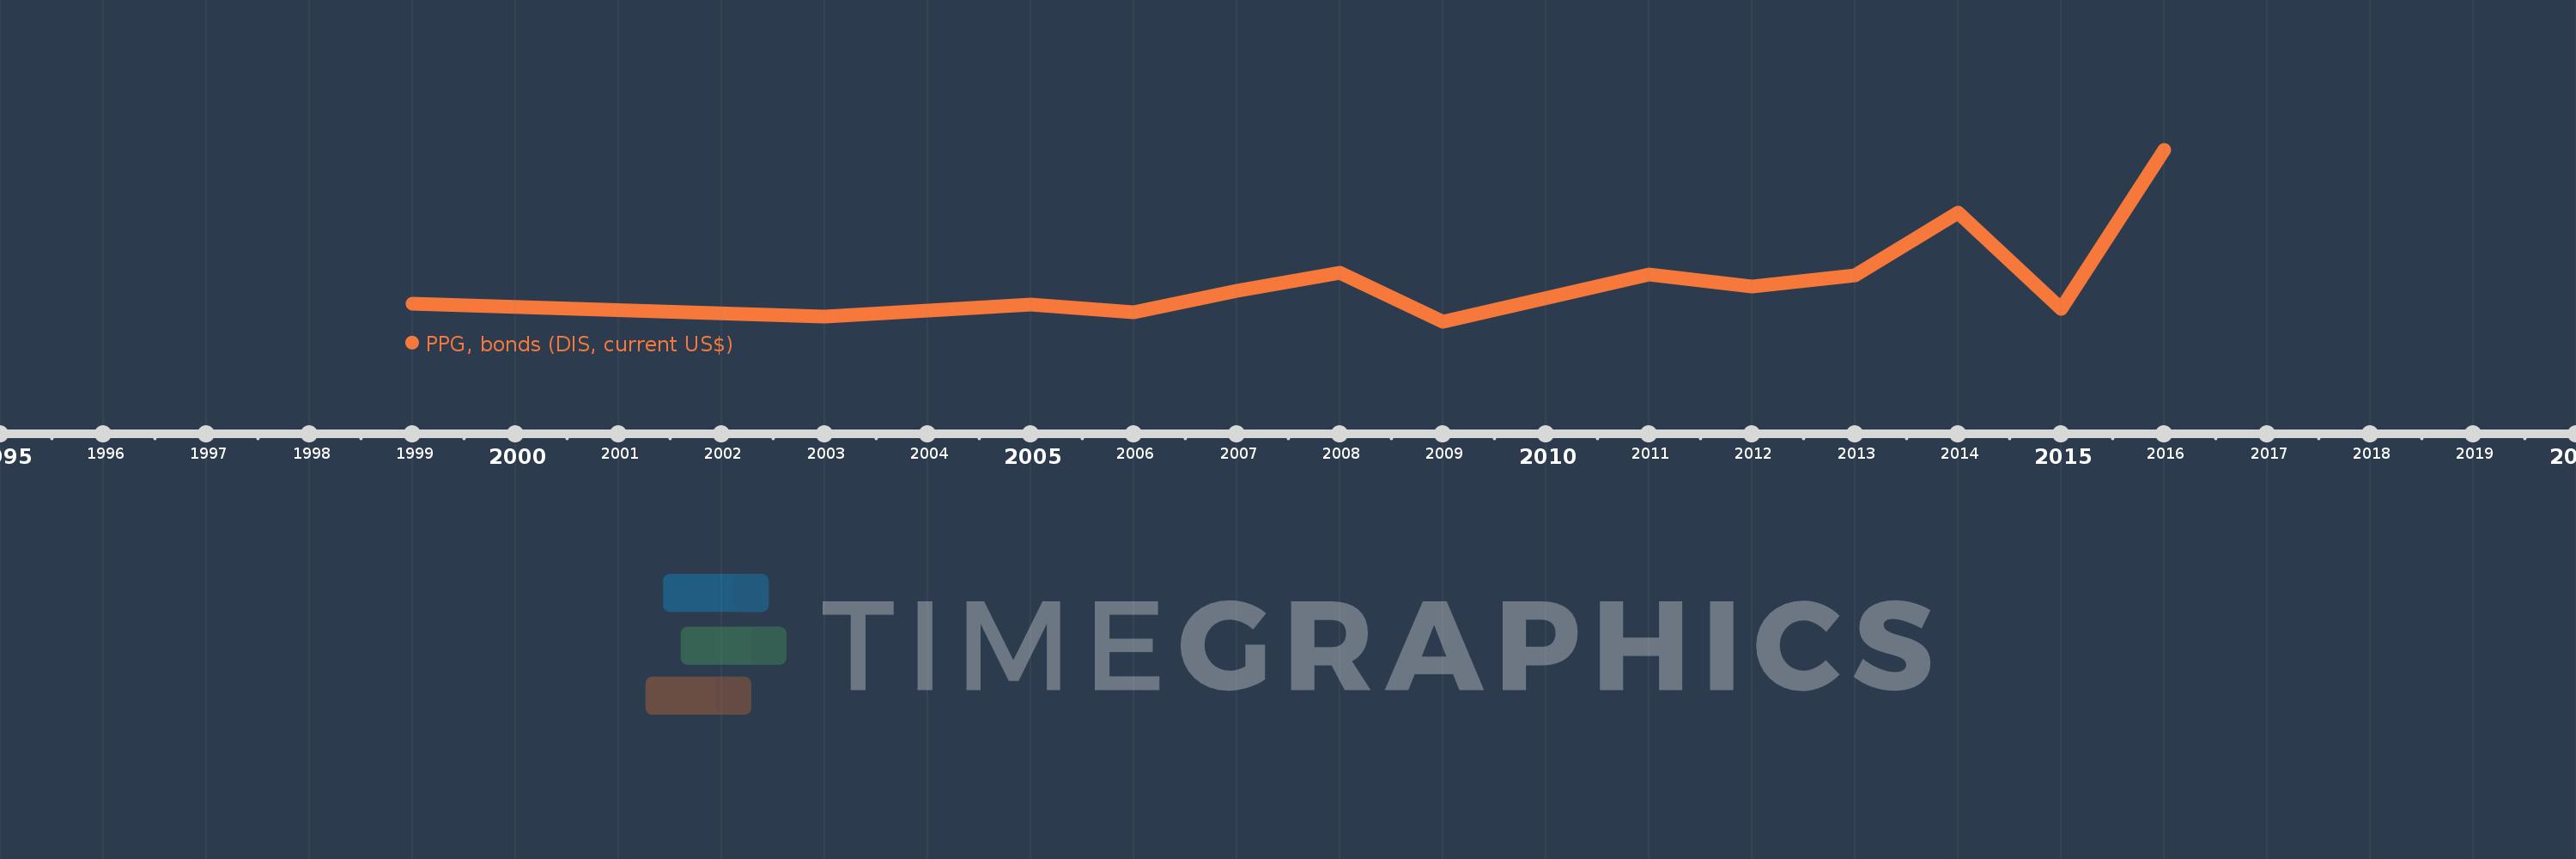
PPG, bonds (DIS, current US$)
2016,2015,2014,2013,2012,2011,2009,2008,2007,2006,2005,2003,1999
This statistics in other country:
Timeline:
This timeline shows a graph from 1999 to 2016 of Ukraine. No data until 1998. Number of actual observations by date: 13.
Source name:
World Development Indicators
Source organization:
World Bank, International Debt Statistics.
Categories, topics:
External Debt
Last updated:
apr 23, 2017
Indicators value changes by year
Maximum:
13.302 bln
jan 1, 2016
At the date of observation
Value
Absolute change
Change from previous value
jan 1, 1999
1.422 bln
+1.422 bln
0.0%
jan 1, 2003
399.0 mln
-1.023 bln
-71.95%
jan 1, 2005
1.357 bln
+958.5 mln
240.23%
jan 1, 2006
747.453 mln
-610.047 mln
-44.94%
jan 1, 2007
2.402 bln
+1.655 bln
221.37%
jan 1, 2008
3.786 bln
+1.384 bln
57.62%
jan 1, 2009
0.0
-3.786 bln
-100.0%
jan 1, 2011
3.685 bln
+3.685 bln
%
jan 1, 2012
2.75 bln
-935.088 mln
-25.37%
jan 1, 2013
3.6 bln
+850.0 mln
30.91%
jan 1, 2014
8.45 bln
+4.85 bln
134.72%
jan 1, 2015
1000.0 mln
-7.45 bln
-88.17%
jan 1, 2016
13.302 bln
+12.302 bln
1.23K%
Ranking of countries by current statistics by years


Comments: