29
/
en
AIzaSyAYiBZKx7MnpbEhh9jyipgxe19OcubqV5w
April 1, 2024
220060
Papua New Guinea
PNG
true
2
1
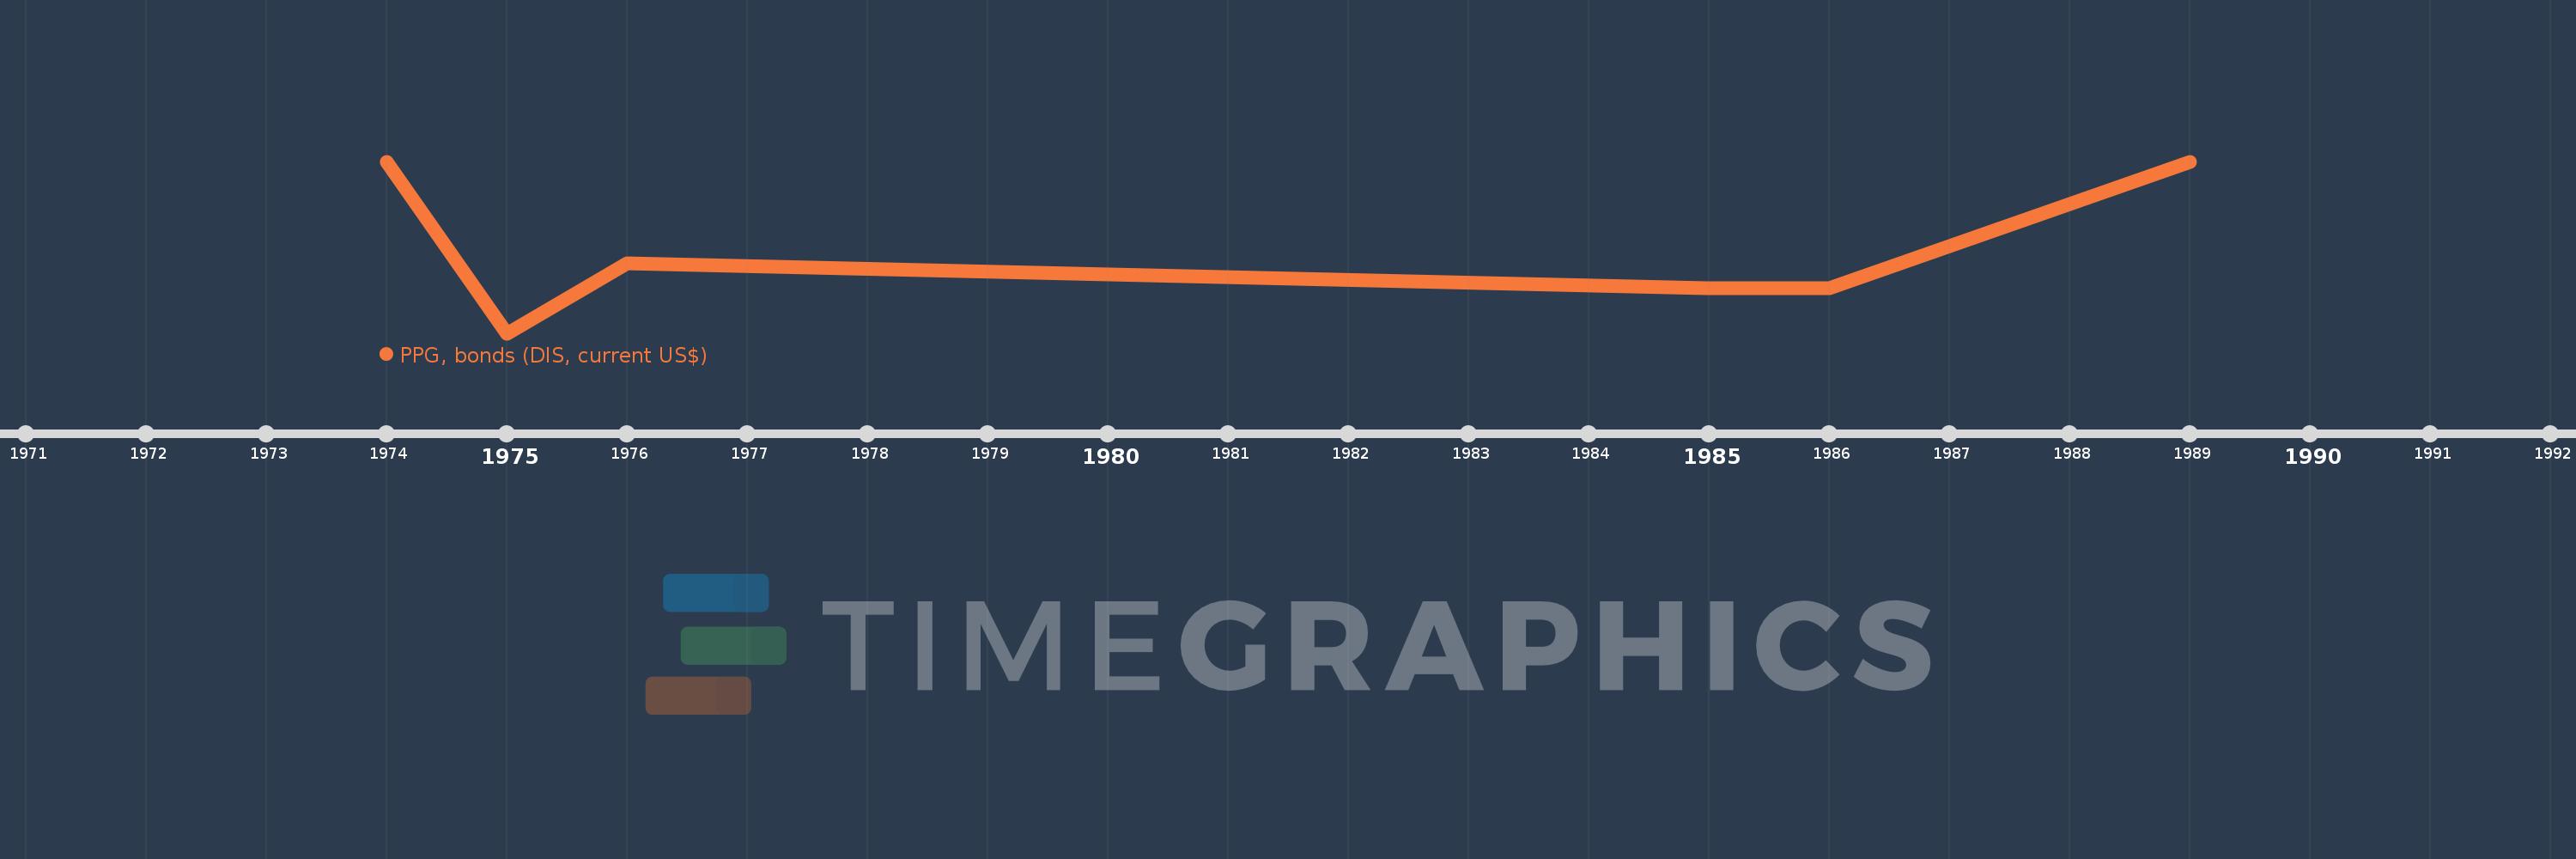
PPG, bonds (DIS, current US$)
1989,1986,1985,1976,1975,1974
This statistics in other country:
Timeline:
This timeline shows a graph from 1974 to 1989 of Papua New Guinea. No data until 1973. Number of actual observations by date: 6.
Source name:
World Development Indicators
Source organization:
World Bank, International Debt Statistics.
Categories, topics:
External Debt
Last updated:
apr 23, 2017
Indicators value changes by year
Minimum:
15.651 mln
jan 1, 1975
Maximum:
36.507 mln
jan 1, 1989
At the date of observation
Value
Absolute change
Change from previous value
jan 1, 1974
36.473 mln
+36.473 mln
0.0%
jan 1, 1975
15.651 mln
-20.822 mln
-57.09%
jan 1, 1976
24.118 mln
+8.467 mln
54.1%
jan 1, 1985
21.075 mln
-3.043 mln
-12.62%
jan 1, 1986
21.12 mln
+45.0K
0.21%
jan 1, 1989
36.507 mln
+15.387 mln
72.86%
Ranking of countries by current statistics by years


Comments: