29
/
en
AIzaSyAYiBZKx7MnpbEhh9jyipgxe19OcubqV5w
April 1, 2024
32037
Europe & Central Asia (excluding high income)
ECA
false
2
1
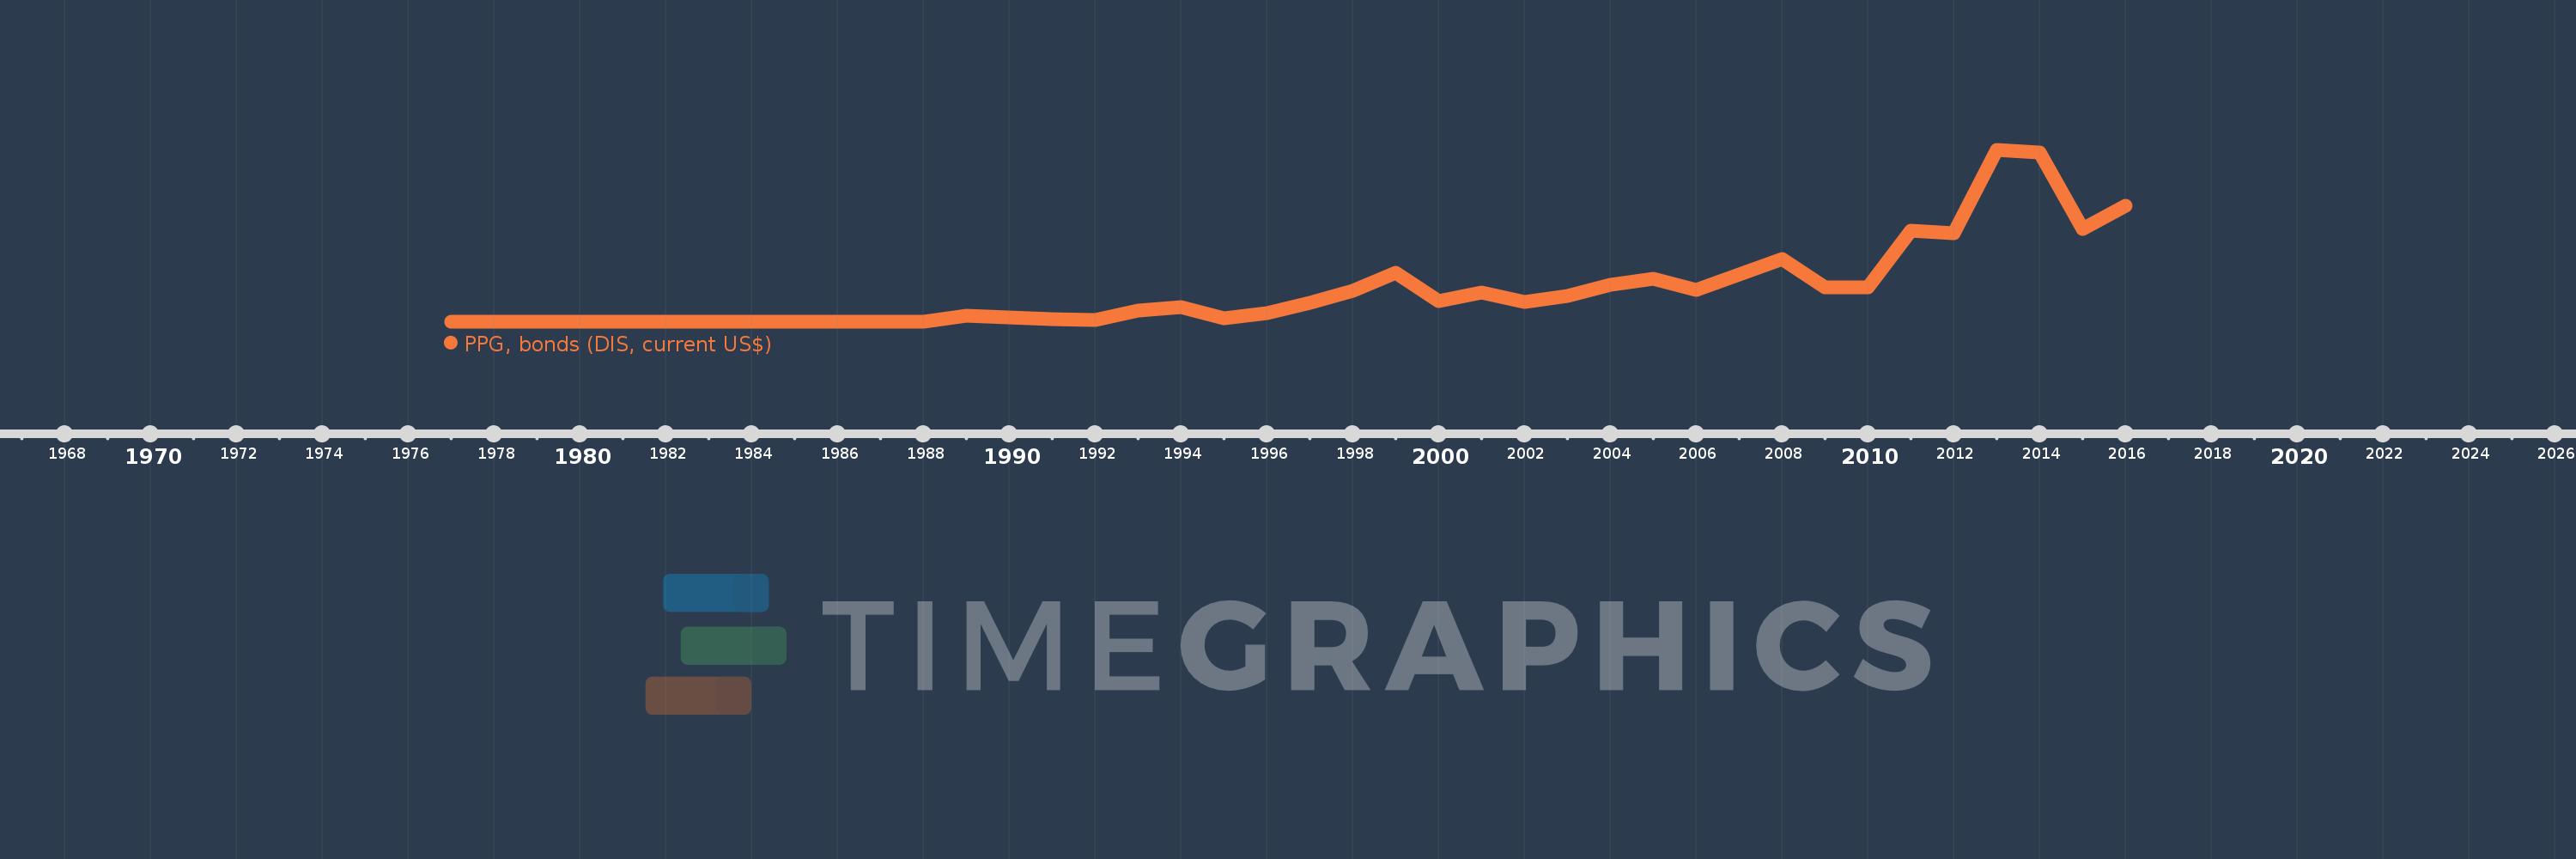
PPG, bonds (DIS, current US$)
2016,2015,2014,2013,2012,2011,2010,2009,2008,2007,2006,2005,2004,2003,2002,2001,2000,1999,1998,1997,1996,1995,1994,1993,1992,1991,1990,1989,1988,1977
This statistics in other country:
Timeline:
This timeline shows a graph from 1977 to 2016 of Europe & Central Asia (excluding high income). No data until 1976. Number of actual observations by date: 30.
Source name:
World Development Indicators
Source organization:
World Bank, International Debt Statistics.
Categories, topics:
External Debt
Last updated:
apr 23, 2017
Indicators value changes by year
Minimum:
23.822 mln
jan 1, 1977
Maximum:
43.845 bln
jan 1, 2013
At the date of observation
Value
Absolute change
Change from previous value
jan 1, 1977
23.822 mln
+23.822 mln
0.0%
jan 1, 1988
184.662 mln
+160.84 mln
675.17%
jan 1, 1989
1.61 bln
+1.425 bln
771.92%
jan 1, 1990
1.284 bln
-326.268 mln
-20.26%
jan 1, 1991
708.419 mln
-575.413 mln
-44.82%
jan 1, 1992
577.415 mln
-131.004 mln
-18.49%
jan 1, 1993
3.043 bln
+2.465 bln
426.98%
jan 1, 1994
3.709 bln
+665.66 mln
21.88%
jan 1, 1995
913.606 mln
-2.795 bln
-75.36%
jan 1, 1996
2.376 bln
+1.462 bln
160.05%
jan 1, 1997
4.925 bln
+2.549 bln
107.31%
jan 1, 1998
8.037 bln
+3.112 bln
63.18%
jan 1, 1999
12.582 bln
+4.544 bln
56.54%
jan 1, 2000
5.265 bln
-7.317 bln
-58.16%
jan 1, 2001
7.468 bln
+2.204 bln
41.86%
jan 1, 2002
5.034 bln
-2.434 bln
-32.6%
jan 1, 2003
6.692 bln
+1.659 bln
32.95%
jan 1, 2004
9.406 bln
+2.714 bln
40.55%
jan 1, 2005
11.041 bln
+1.635 bln
17.38%
jan 1, 2006
8.282 bln
-2.759 bln
-24.99%
jan 1, 2007
12.105 bln
+3.824 bln
46.17%
jan 1, 2008
16.089 bln
+3.983 bln
32.91%
jan 1, 2009
8.857 bln
-7.232 bln
-44.95%
jan 1, 2010
8.831 bln
-25.964 mln
-0.29%
jan 1, 2011
23.255 bln
+14.425 bln
163.35%
jan 1, 2012
22.588 bln
-667.591 mln
-2.87%
jan 1, 2013
43.845 bln
+21.258 bln
94.11%
jan 1, 2014
43.241 bln
-603.915 mln
-1.38%
jan 1, 2015
23.7 bln
-19.541 bln
-45.19%
jan 1, 2016
29.727 bln
+6.027 bln
25.43%
Ranking of countries by current statistics by years


Comments: