29
/
en
AIzaSyAYiBZKx7MnpbEhh9jyipgxe19OcubqV5w
April 1, 2024
246129
South Africa
ZAF
true
2
1
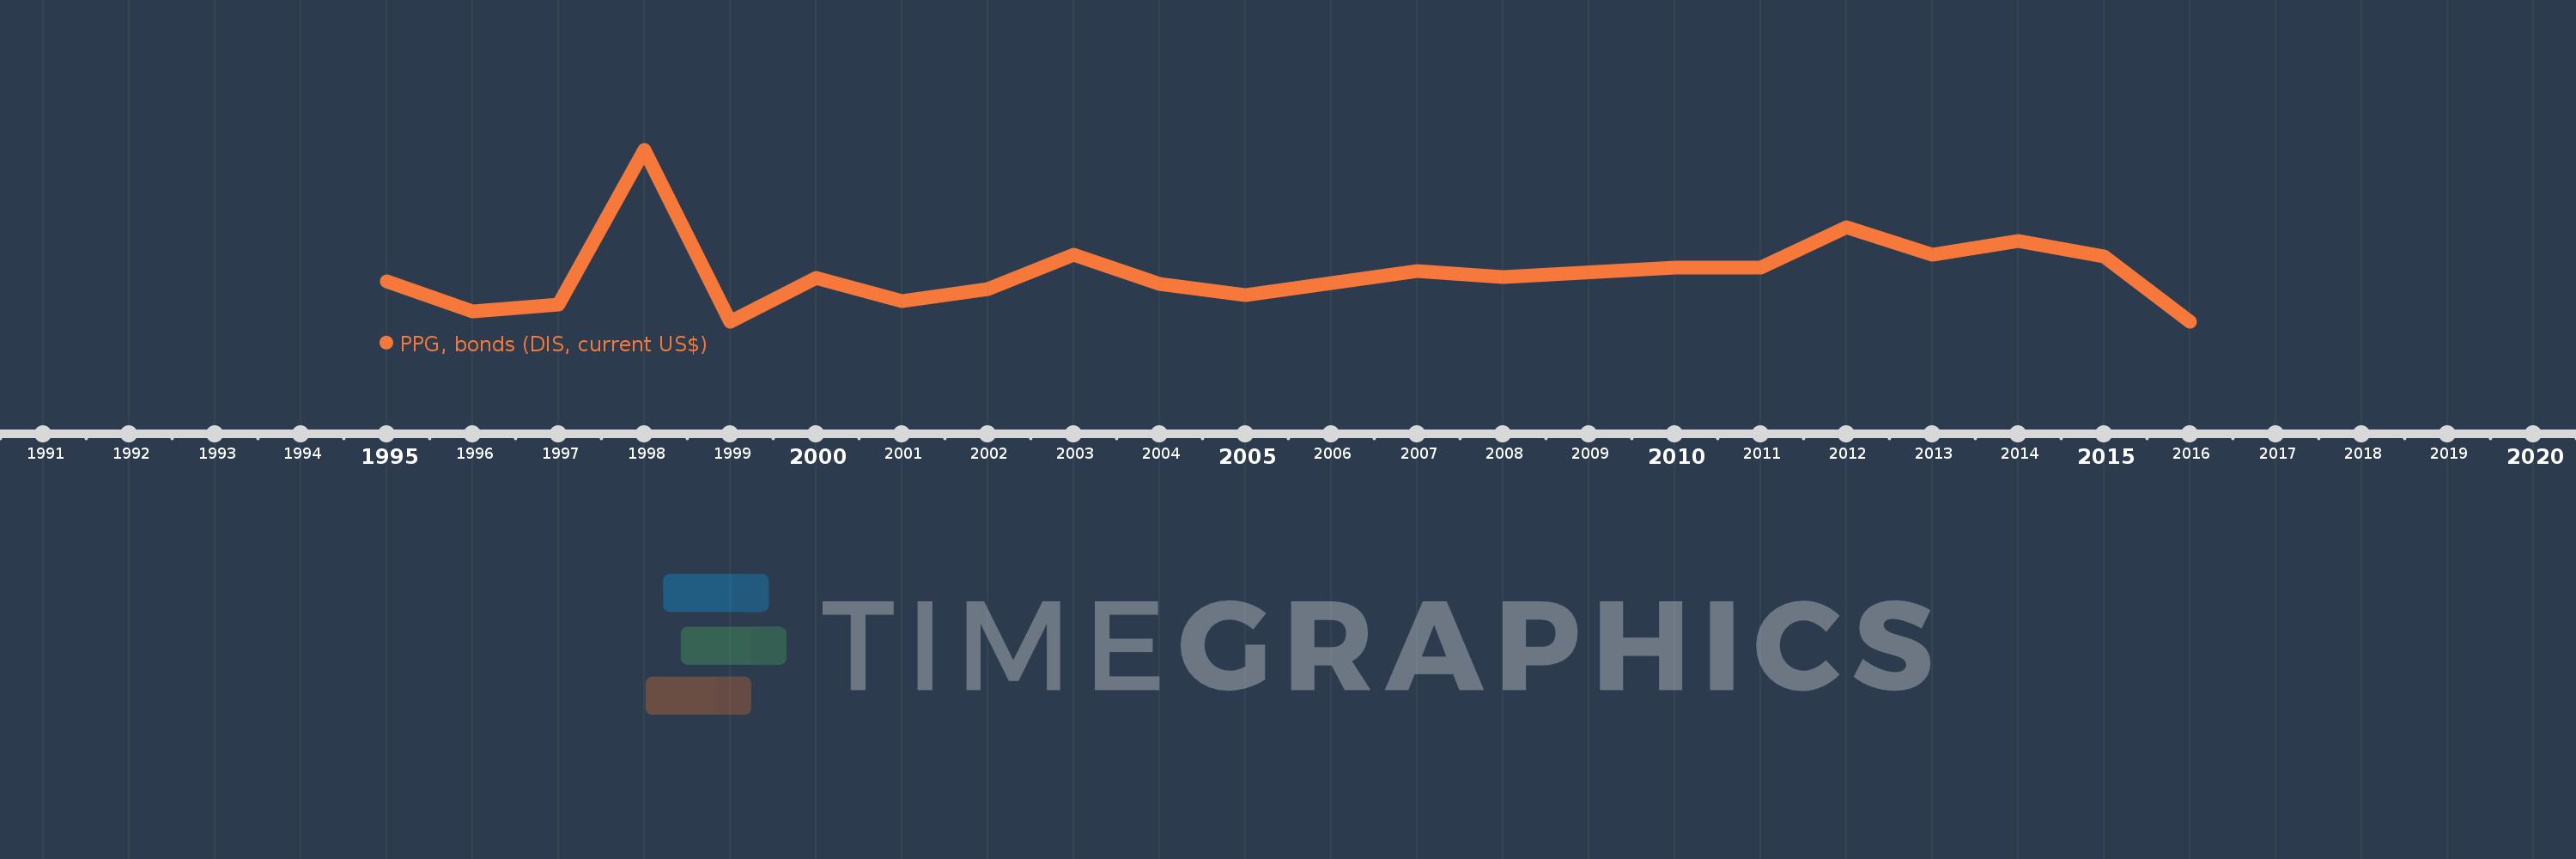
PPG, bonds (DIS, current US$)
2016,2015,2014,2013,2012,2011,2010,2008,2007,2005,2004,2003,2002,2001,2000,1999,1998,1997,1996,1995
This statistics in other country:
Timeline:
This timeline shows a graph from 1995 to 2016 of South Africa. No data until 1994. Number of actual observations by date: 20.
Source name:
World Development Indicators
Source organization:
World Bank, International Debt Statistics.
Categories, topics:
External Debt
Last updated:
apr 23, 2017
Indicators value changes by year
Maximum:
6.353 bln
jan 1, 1998
At the date of observation
Value
Absolute change
Change from previous value
jan 1, 1995
1.51 bln
+1.51 bln
0.0%
jan 1, 1996
390.889 mln
-1.119 bln
-74.11%
jan 1, 1997
632.4 mln
+241.511 mln
61.79%
jan 1, 1998
6.353 bln
+5.72 bln
904.52%
jan 1, 1999
0.0
-6.353 bln
-100.0%
jan 1, 2000
1.627 bln
+1.627 bln
%
jan 1, 2001
765.384 mln
-861.616 mln
-52.96%
jan 1, 2002
1.222 bln
+456.616 mln
59.66%
jan 1, 2003
2.472 bln
+1.25 bln
102.29%
jan 1, 2004
1.414 bln
-1.058 bln
-42.82%
jan 1, 2005
1000.0 mln
-413.534 mln
-29.26%
jan 1, 2007
1.876 bln
+876.441 mln
87.64%
jan 1, 2008
1.67 bln
-206.441 mln
-11.0%
jan 1, 2010
2.0 bln
+330.0 mln
19.76%
jan 1, 2011
2.0 bln
0.0
0.0%
jan 1, 2012
3.5 bln
+1.5 bln
75.0%
jan 1, 2013
2.5 bln
-1000.0 mln
-28.57%
jan 1, 2014
3.0 bln
+500.0 mln
20.0%
jan 1, 2015
2.429 bln
-571.337 mln
-19.04%
jan 1, 2016
0.0
-2.429 bln
-100.0%
Ranking of countries by current statistics by years


Comments: