30
/
AIzaSyAYiBZKx7MnpbEhh9jyipgxe19OcubqV5w
April 1, 2024
64326
Albania
ALB
true
2
1
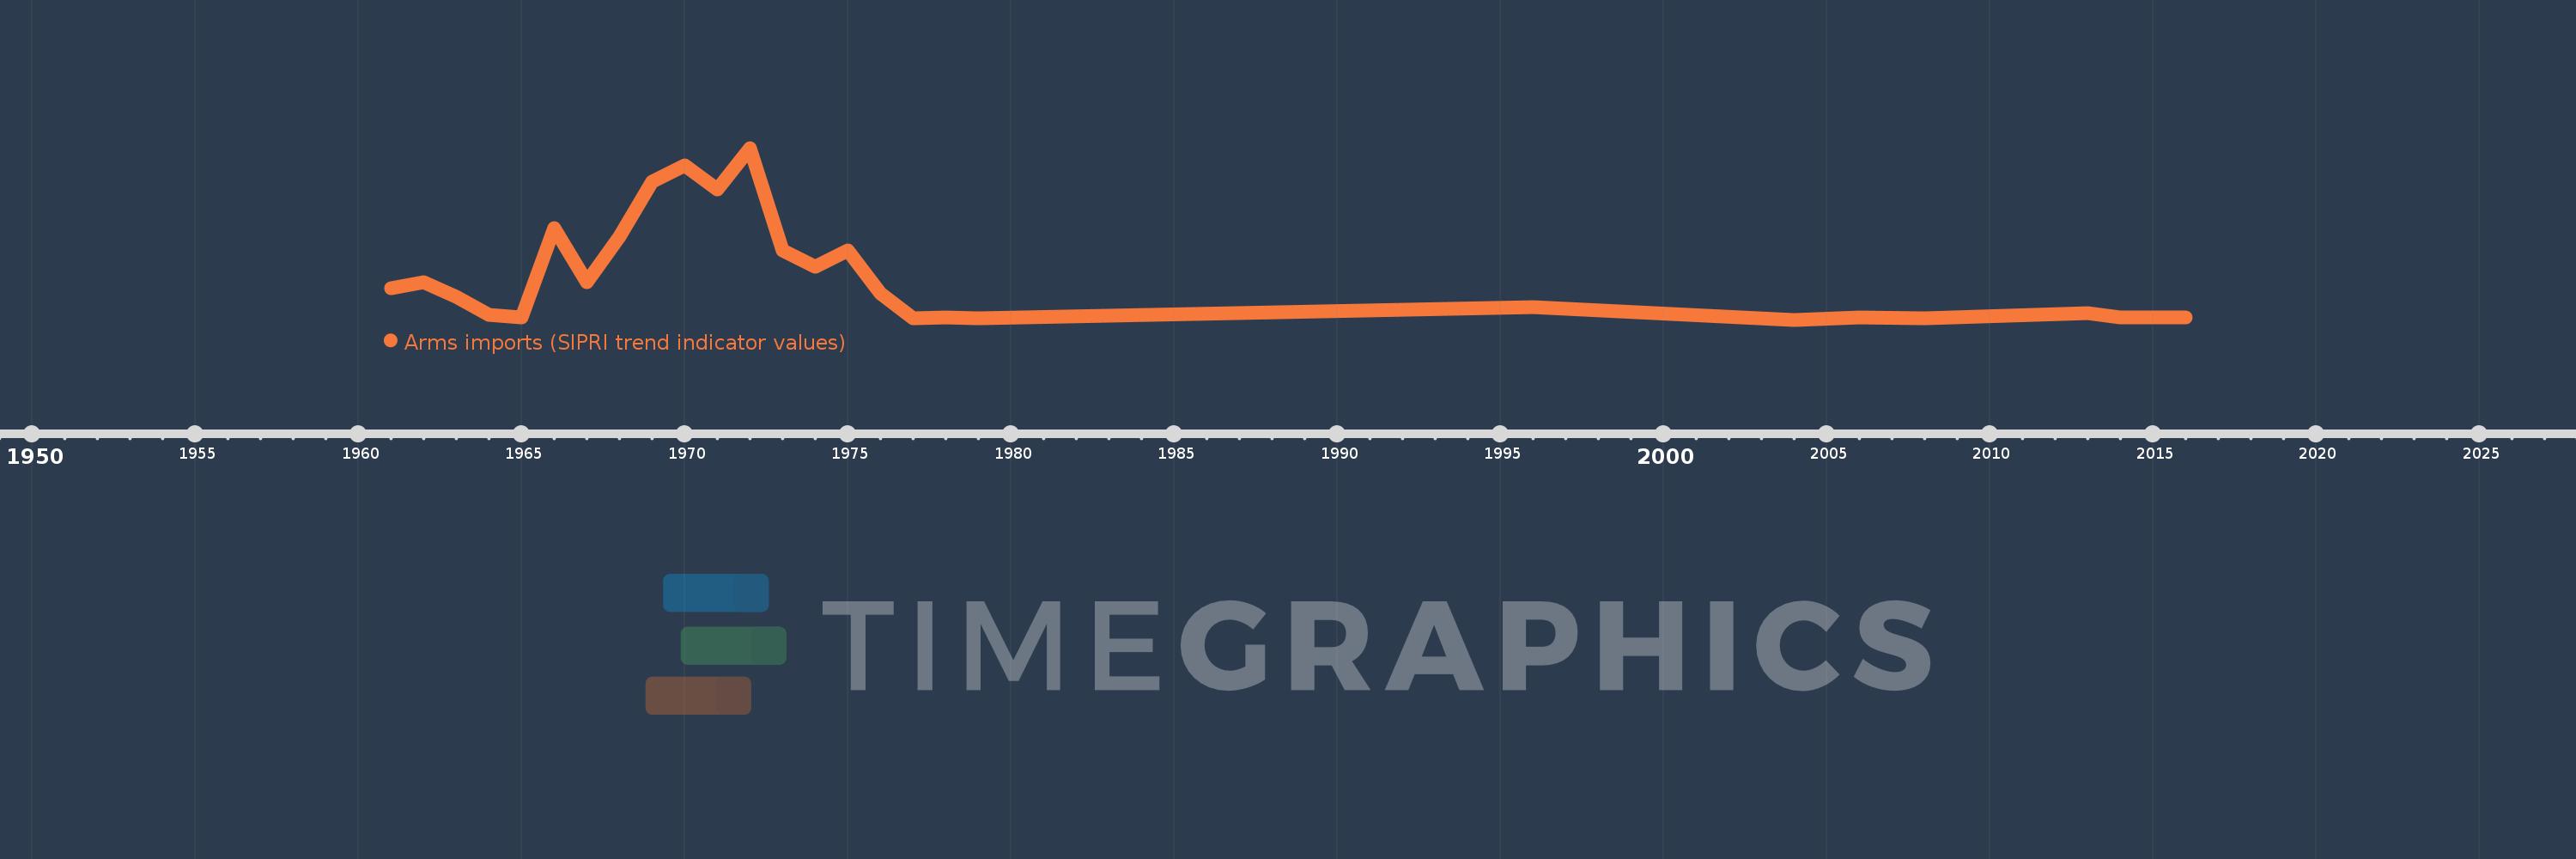
Arms imports (SIPRI trend indicator values)
2016,2015,2014,2013,2008,2006,2004,1996,1979,1978,1977,1976,1975,1974,1973,1972,1971,1970,1969,1968,1967,1966,1965,1964,1963,1962,1961
