29
/
en
AIzaSyAYiBZKx7MnpbEhh9jyipgxe19OcubqV5w
April 1, 2024
47939
Middle East & North Africa
MEA
false
2
1
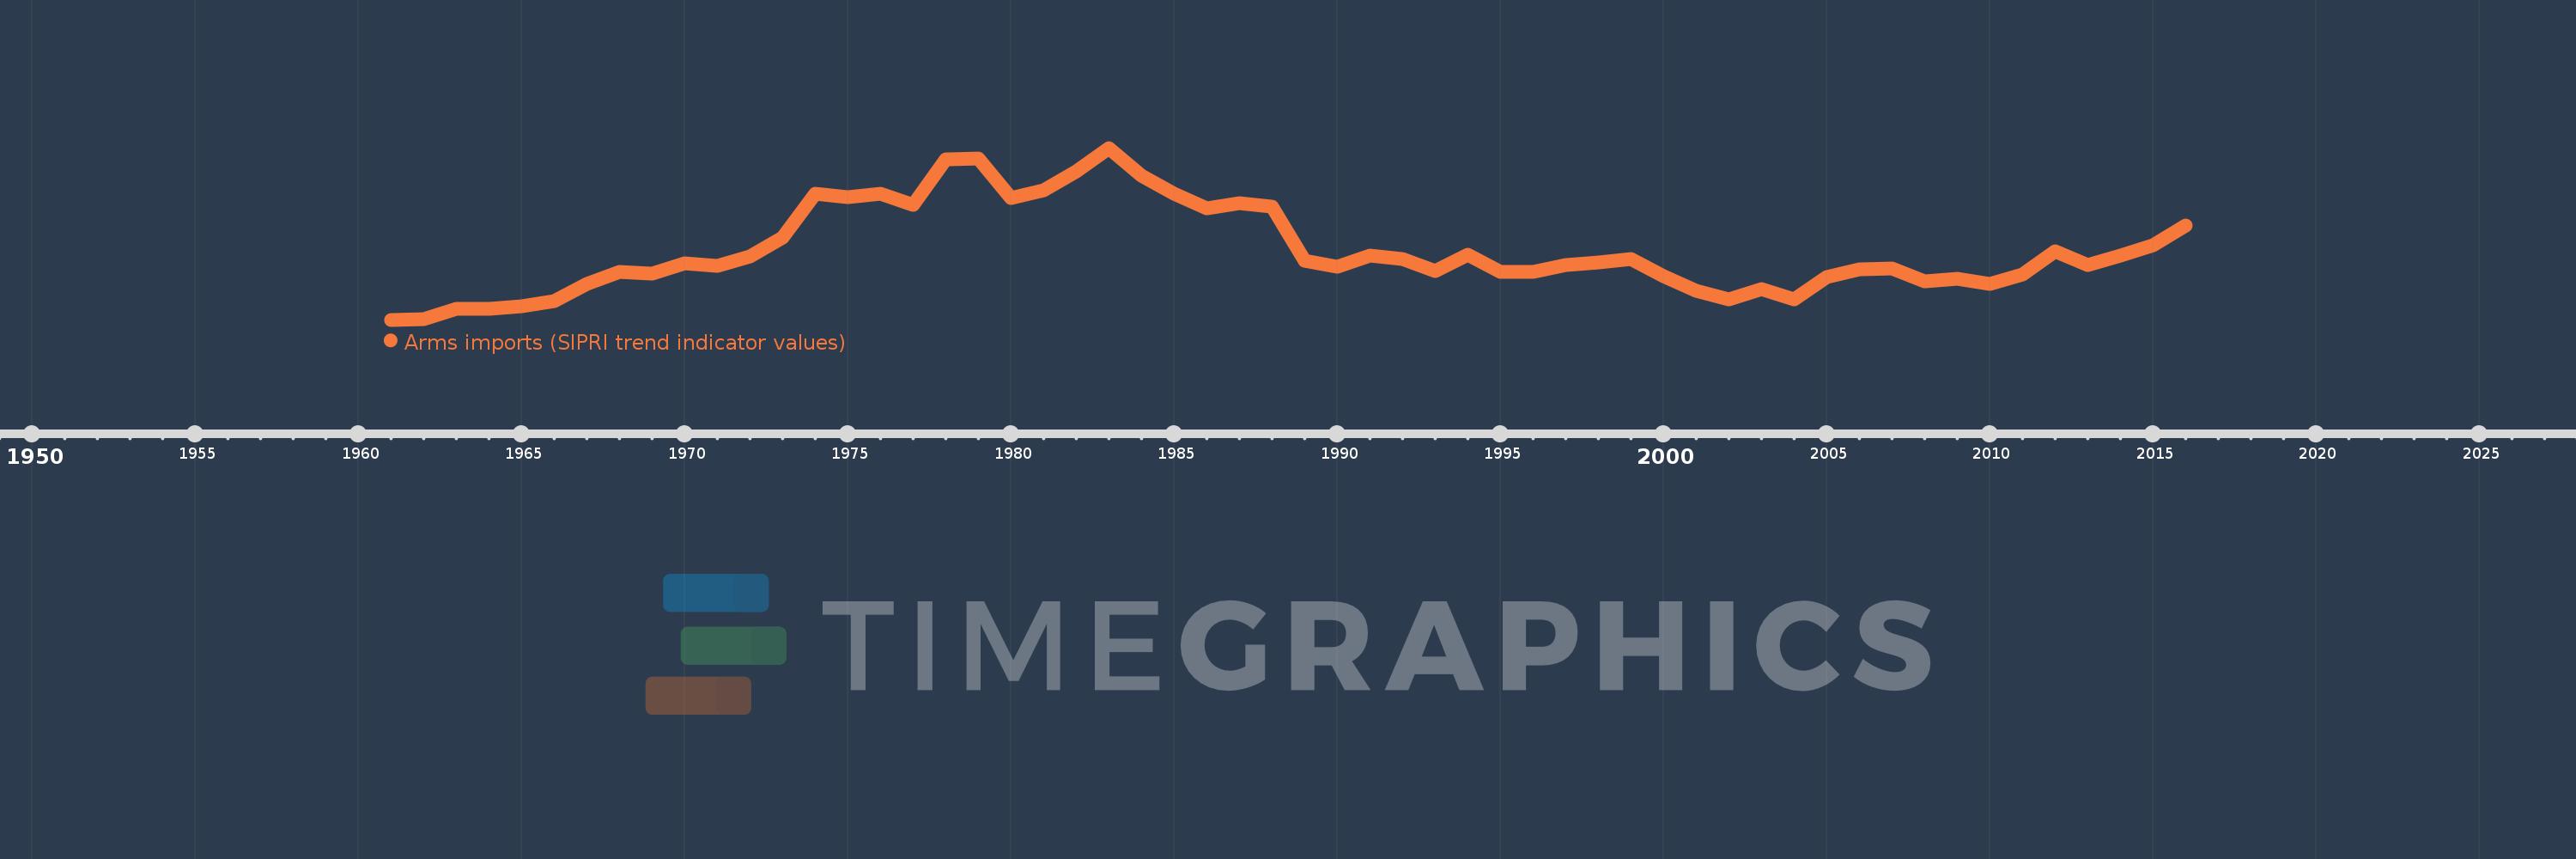
Arms imports (SIPRI trend indicator values)
2016,2015,2014,2013,2012,2011,2010,2009,2008,2007,2006,2005,2004,2003,2002,2001,2000,1999,1998,1997,1996,1995,1994,1993,1992,1991,1990,1989,1988,1987,1986,1985,1984,1983,1982,1981,1980,1979,1978,1977,1976,1975,1974,1973,1972,1971,1970,1969,1968,1967,1966,1965,1964,1963,1962,1961
This statistics in other country:
AfghanistanAlbaniaAlgeriaAngolaArab WorldArgentinaArmeniaAustraliaAustriaAzerbaijanBahamas, TheBahrainBangladeshBarbadosBelarusBelgiumBelizeBeninBhutanBoliviaBosnia and HerzegovinaBotswanaBrazilBrunei DarussalamBulgariaBurkina FasoBurundiCabo VerdeCambodiaCameroonCanadaCaribbean small statesCentral African RepublicCentral Europe and the BalticsChadChileChinaColombiaComorosCongo, Dem. Rep.Congo, Rep.Costa RicaCote d'IvoireCroatiaCubaCyprusCzech RepublicDenmarkDjiboutiDominican RepublicEarly-demographic dividendEast Asia & PacificEast Asia & Pacific (excluding high income)East Asia & Pacific (IDA & IBRD countries)EcuadorEgypt, Arab Rep.El SalvadorEquatorial GuineaEritreaEstoniaEthiopiaEuro areaEurope & Central AsiaEurope & Central Asia (excluding high income)Europe & Central Asia (IDA & IBRD countries)European UnionFijiFinlandFragile and conflict affected situationsFranceGabonGambia, TheGeorgiaGermanyGhanaGreeceGrenadaGuatemalaGuineaGuinea-BissauGuyanaHaitiHeavily indebted poor countries (HIPC)High incomeHondurasHungaryIBRD onlyIcelandIDA & IBRD totalIDA blendIDA onlyIDA totalIndiaIndonesiaIran, Islamic Rep.IraqIrelandIsraelItalyJamaicaJapanJordanKazakhstanKenyaKiribatiKorea, Dem. People’s Rep.Korea, Rep.KosovoKuwaitKyrgyz RepublicLao PDRLate-demographic dividendLatin America & Caribbean Latin America & Caribbean (excluding high income)Latin America & the Caribbean (IDA & IBRD countries)LatviaLeast developed countries: UN classificationLebanonLesothoLiberiaLibyaLithuaniaLow & middle incomeLow incomeLower middle incomeLuxembourgMacedonia, FYRMadagascarMalawiMalaysiaMaldivesMaliMaltaMarshall IslandsMauritaniaMauritiusMexicoMicronesia, Fed. Sts.Middle East & North AfricaMiddle East & North Africa (excluding high income)Middle East & North Africa (IDA & IBRD countries)Middle incomeMoldovaMongoliaMoroccoMozambiqueMyanmarNamibiaNepalNetherlandsNew ZealandNicaraguaNigerNigeriaNorth AmericaNorwayOECD membersOmanOther small statesPacific island small statesPakistanPalauPanamaPapua New GuineaParaguayPeruPhilippinesPolandPortugalPost-demographic dividendPre-demographic dividendQatarRomaniaRussian FederationRwandaSamoaSaudi ArabiaSenegalSerbiaSeychellesSierra LeoneSingaporeSlovak RepublicSloveniaSmall statesSolomon IslandsSomaliaSouth AfricaSouth AsiaSouth Asia (IDA & IBRD)South SudanSpainSri LankaSt. Kitts and NevisSt. Vincent and the GrenadinesSub-Saharan Africa Sub-Saharan Africa (excluding high income)Sub-Saharan Africa (IDA & IBRD countries)SudanSurinameSwazilandSwedenSwitzerlandSyrian Arab RepublicTajikistanTanzaniaThailandTimor-LesteTogoTongaTrinidad and TobagoTunisiaTurkeyTurkmenistanTuvaluUgandaUkraineUnited Arab EmiratesUnited KingdomUnited StatesUpper middle incomeUruguayUzbekistanVanuatuVenezuela, RBVietnamWest Bank and GazaWorldYemen, Rep.ZambiaZimbabwe Timeline:
This timeline shows a graph from 1961 to 2016 of Middle East & North Africa. No data until 1960. Number of actual observations by date: 56.
Source name:
World Development Indicators
Source organization:
Stockholm International Peace Research Institute (SIPRI), Arms Transfers Programme (http://portal.sipri.org/publications/pages/transfer/splash).
Categories, topics:
Public Sector, Trade
Last updated:
apr 23, 2017
Indicators value changes by year
Minimum:
695.0 mln
jan 1, 1961
Maximum:
17.464 bln
jan 1, 1983
At the date of observation
Value
Absolute change
Change from previous value
jan 1, 1961
695.0 mln
+695.0 mln
0.0%
jan 1, 1962
753.0 mln
+58.0 mln
8.35%
jan 1, 1963
1.768 bln
+1.015 bln
134.79%
jan 1, 1964
1.773 bln
+5.0 mln
0.28%
jan 1, 1965
2.046 bln
+273.0 mln
15.4%
jan 1, 1966
2.511 bln
+465.0 mln
22.73%
jan 1, 1967
4.173 bln
+1.662 bln
66.19%
jan 1, 1968
5.351 bln
+1.178 bln
28.23%
jan 1, 1969
5.195 bln
-156.0 mln
-2.92%
jan 1, 1970
6.179 bln
+984.0 mln
18.94%
jan 1, 1971
5.973 bln
-206.0 mln
-3.33%
jan 1, 1972
6.839 bln
+866.0 mln
14.5%
jan 1, 1973
8.742 bln
+1.903 bln
27.83%
jan 1, 1974
12.973 bln
+4.231 bln
48.4%
jan 1, 1975
12.698 bln
-275.0 mln
-2.12%
jan 1, 1976
13.018 bln
+320.0 mln
2.52%
jan 1, 1977
11.933 bln
-1.085 bln
-8.33%
jan 1, 1978
16.371 bln
+4.438 bln
37.19%
jan 1, 1979
16.42 bln
+49.0 mln
0.3%
jan 1, 1980
12.576 bln
-3.844 bln
-23.41%
jan 1, 1981
13.335 bln
+759.0 mln
6.04%
jan 1, 1982
15.159 bln
+1.824 bln
13.68%
jan 1, 1983
17.464 bln
+2.305 bln
15.21%
jan 1, 1984
14.732 bln
-2.732 bln
-15.64%
jan 1, 1985
13.001 bln
-1.731 bln
-11.75%
jan 1, 1986
11.577 bln
-1.424 bln
-10.95%
jan 1, 1987
12.053 bln
+476.0 mln
4.11%
jan 1, 1988
11.771 bln
-282.0 mln
-2.34%
jan 1, 1989
6.435 bln
-5.336 bln
-45.33%
jan 1, 1990
5.887 bln
-548.0 mln
-8.52%
jan 1, 1991
6.973 bln
+1.086 bln
18.45%
jan 1, 1992
6.59 bln
-383.0 mln
-5.49%
jan 1, 1993
5.433 bln
-1.157 bln
-17.56%
jan 1, 1994
7.01 bln
+1.577 bln
29.03%
jan 1, 1995
5.36 bln
-1.65 bln
-23.54%
jan 1, 1996
5.378 bln
+18.0 mln
0.34%
jan 1, 1997
6.062 bln
+684.0 mln
12.72%
jan 1, 1998
6.288 bln
+226.0 mln
3.73%
jan 1, 1999
6.604 bln
+316.0 mln
5.03%
jan 1, 2000
4.955 bln
-1.649 bln
-24.97%
jan 1, 2001
3.528 bln
-1.427 bln
-28.8%
jan 1, 2002
2.72 bln
-808.0 mln
-22.9%
jan 1, 2003
3.67 bln
+950.0 mln
34.93%
jan 1, 2004
2.666 bln
-1.004 bln
-27.36%
jan 1, 2005
4.827 bln
+2.161 bln
81.06%
jan 1, 2006
5.598 bln
+771.0 mln
15.97%
jan 1, 2007
5.712 bln
+114.0 mln
2.04%
jan 1, 2008
4.408 bln
-1.304 bln
-22.83%
jan 1, 2009
4.735 bln
+327.0 mln
7.42%
jan 1, 2010
4.155 bln
-580.0 mln
-12.25%
jan 1, 2011
5.111 bln
+956.0 mln
23.01%
jan 1, 2012
7.366 bln
+2.255 bln
44.12%
jan 1, 2013
6.003 bln
-1.363 bln
-18.5%
jan 1, 2014
6.94 bln
+937.0 mln
15.61%
jan 1, 2015
7.961 bln
+1.021 bln
14.71%
jan 1, 2016
9.934 bln
+1.973 bln
24.78%
Ranking of countries by current statistics by years


Comments: