29
/
en
AIzaSyAYiBZKx7MnpbEhh9jyipgxe19OcubqV5w
April 1, 2024
81507
Belgium
BEL
true
2
1
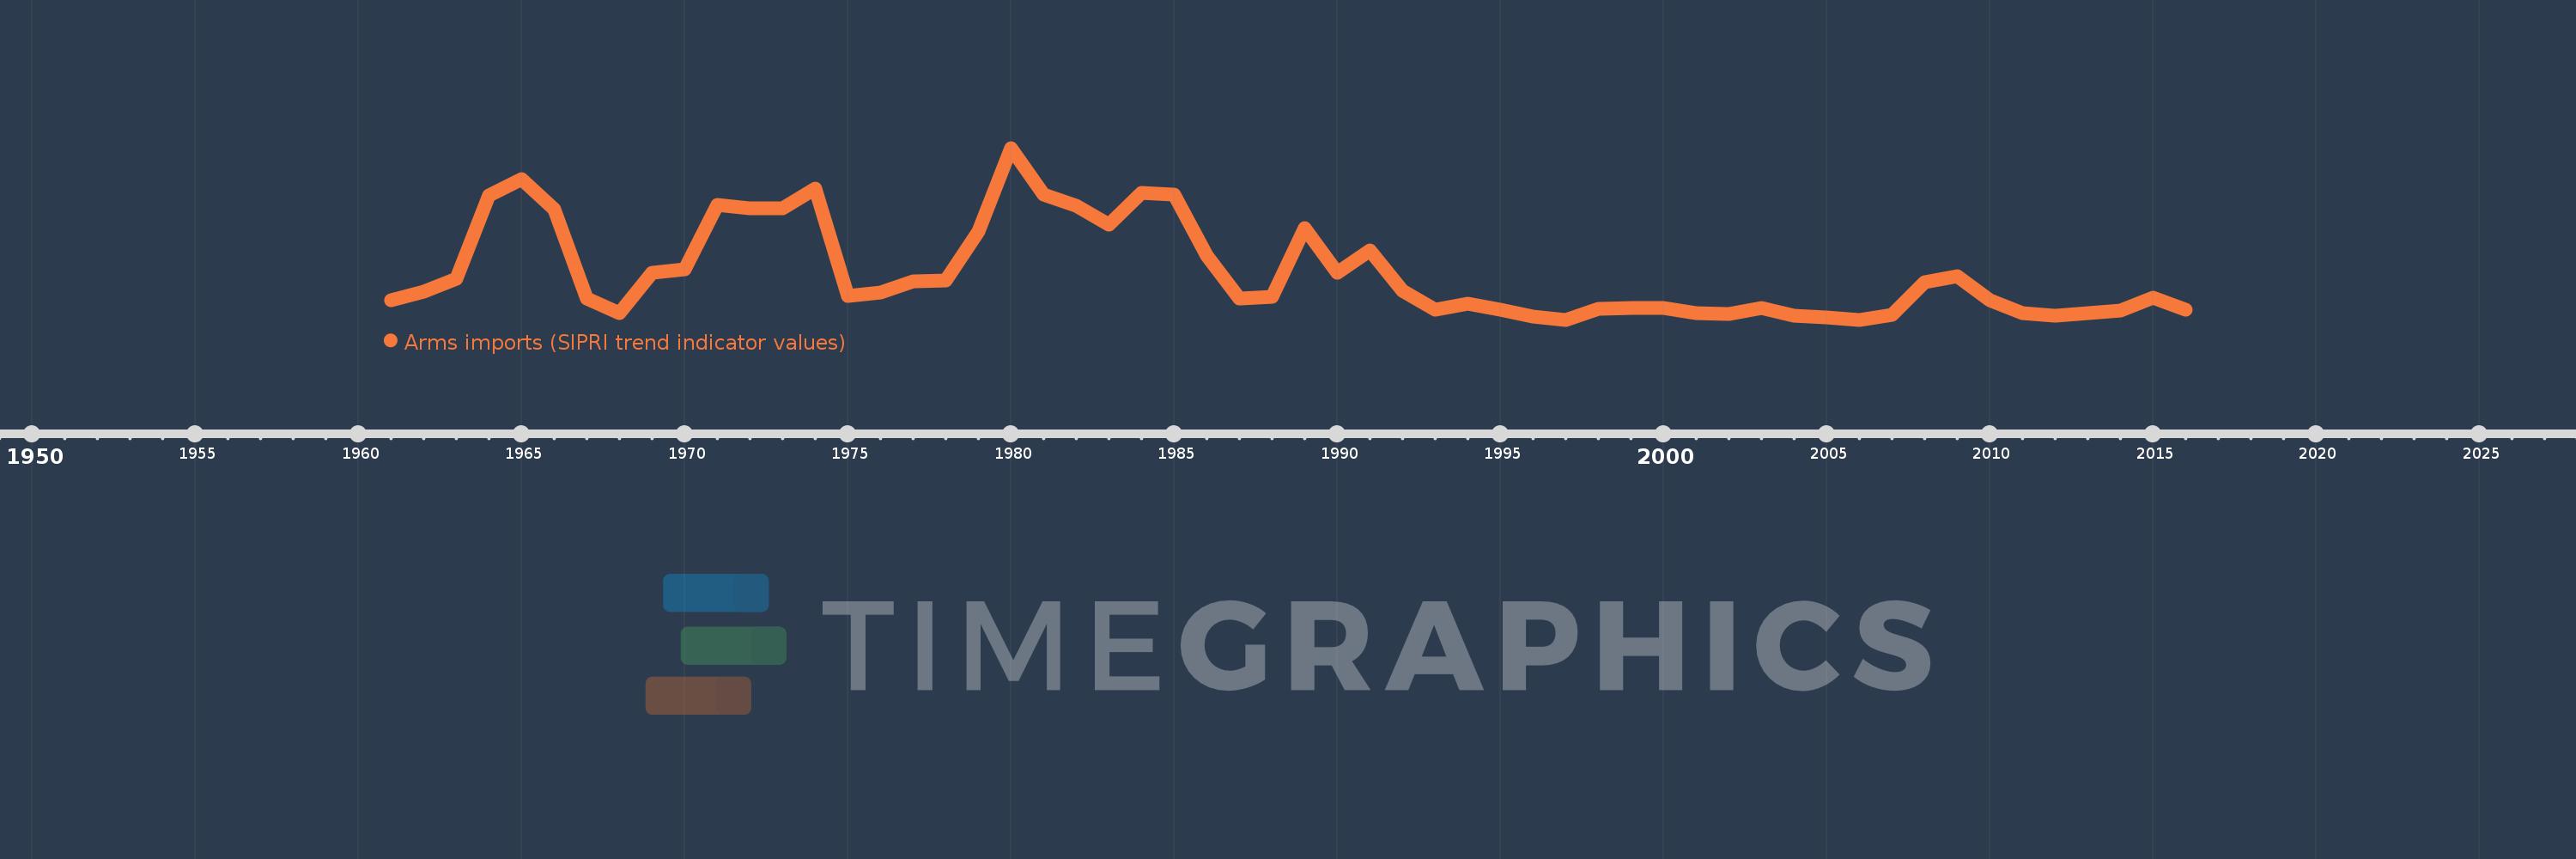
Arms imports (SIPRI trend indicator values)
2016,2015,2014,2013,2012,2011,2010,2009,2008,2007,2006,2005,2004,2003,2002,2001,2000,1999,1998,1997,1996,1995,1994,1993,1992,1991,1990,1989,1988,1987,1986,1985,1984,1983,1982,1981,1980,1979,1978,1977,1976,1975,1974,1973,1972,1971,1970,1969,1968,1967,1966,1965,1964,1963,1962,1961
This statistics in other country:
AfghanistanAlbaniaAlgeriaAngolaArab WorldArgentinaArmeniaAustraliaAustriaAzerbaijanBahamas, TheBahrainBangladeshBarbadosBelarusBelgiumBelizeBeninBhutanBoliviaBosnia and HerzegovinaBotswanaBrazilBrunei DarussalamBulgariaBurkina FasoBurundiCabo VerdeCambodiaCameroonCanadaCaribbean small statesCentral African RepublicCentral Europe and the BalticsChadChileChinaColombiaComorosCongo, Dem. Rep.Congo, Rep.Costa RicaCote d'IvoireCroatiaCubaCyprusCzech RepublicDenmarkDjiboutiDominican RepublicEarly-demographic dividendEast Asia & PacificEast Asia & Pacific (excluding high income)East Asia & Pacific (IDA & IBRD countries)EcuadorEgypt, Arab Rep.El SalvadorEquatorial GuineaEritreaEstoniaEthiopiaEuro areaEurope & Central AsiaEurope & Central Asia (excluding high income)Europe & Central Asia (IDA & IBRD countries)European UnionFijiFinlandFragile and conflict affected situationsFranceGabonGambia, TheGeorgiaGermanyGhanaGreeceGrenadaGuatemalaGuineaGuinea-BissauGuyanaHaitiHeavily indebted poor countries (HIPC)High incomeHondurasHungaryIBRD onlyIcelandIDA & IBRD totalIDA blendIDA onlyIDA totalIndiaIndonesiaIran, Islamic Rep.IraqIrelandIsraelItalyJamaicaJapanJordanKazakhstanKenyaKiribatiKorea, Dem. People’s Rep.Korea, Rep.KosovoKuwaitKyrgyz RepublicLao PDRLate-demographic dividendLatin America & Caribbean Latin America & Caribbean (excluding high income)Latin America & the Caribbean (IDA & IBRD countries)LatviaLeast developed countries: UN classificationLebanonLesothoLiberiaLibyaLithuaniaLow & middle incomeLow incomeLower middle incomeLuxembourgMacedonia, FYRMadagascarMalawiMalaysiaMaldivesMaliMaltaMarshall IslandsMauritaniaMauritiusMexicoMicronesia, Fed. Sts.Middle East & North AfricaMiddle East & North Africa (excluding high income)Middle East & North Africa (IDA & IBRD countries)Middle incomeMoldovaMongoliaMoroccoMozambiqueMyanmarNamibiaNepalNetherlandsNew ZealandNicaraguaNigerNigeriaNorth AmericaNorwayOECD membersOmanOther small statesPacific island small statesPakistanPalauPanamaPapua New GuineaParaguayPeruPhilippinesPolandPortugalPost-demographic dividendPre-demographic dividendQatarRomaniaRussian FederationRwandaSamoaSaudi ArabiaSenegalSerbiaSeychellesSierra LeoneSingaporeSlovak RepublicSloveniaSmall statesSolomon IslandsSomaliaSouth AfricaSouth AsiaSouth Asia (IDA & IBRD)South SudanSpainSri LankaSt. Kitts and NevisSt. Vincent and the GrenadinesSub-Saharan Africa Sub-Saharan Africa (excluding high income)Sub-Saharan Africa (IDA & IBRD countries)SudanSurinameSwazilandSwedenSwitzerlandSyrian Arab RepublicTajikistanTanzaniaThailandTimor-LesteTogoTongaTrinidad and TobagoTunisiaTurkeyTurkmenistanTuvaluUgandaUkraineUnited Arab EmiratesUnited KingdomUnited StatesUpper middle incomeUruguayUzbekistanVanuatuVenezuela, RBVietnamWest Bank and GazaWorldYemen, Rep.ZambiaZimbabwe Timeline:
This timeline shows a graph from 1961 to 2016 of Belgium. No data until 1960. Number of actual observations by date: 56.
Source name:
World Development Indicators
Source organization:
Stockholm International Peace Research Institute (SIPRI), Arms Transfers Programme (http://portal.sipri.org/publications/pages/transfer/splash).
Categories, topics:
Public Sector, Trade
Last updated:
apr 23, 2017
Indicators value changes by year
Minimum:
3.0 mln
jan 1, 1997
Maximum:
786.0 mln
jan 1, 1980
At the date of observation
Value
Absolute change
Change from previous value
jan 1, 1961
92.0 mln
+92.0 mln
0.0%
jan 1, 1962
132.0 mln
+40.0 mln
43.48%
jan 1, 1963
188.0 mln
+56.0 mln
42.42%
jan 1, 1964
569.0 mln
+381.0 mln
202.66%
jan 1, 1965
644.0 mln
+75.0 mln
13.18%
jan 1, 1966
505.0 mln
-139.0 mln
-21.58%
jan 1, 1967
101.0 mln
-404.0 mln
-80.0%
jan 1, 1968
35.0 mln
-66.0 mln
-65.35%
jan 1, 1969
216.0 mln
+181.0 mln
517.14%
jan 1, 1970
232.0 mln
+16.0 mln
7.41%
jan 1, 1971
528.0 mln
+296.0 mln
127.59%
jan 1, 1972
509.0 mln
-19.0 mln
-3.6%
jan 1, 1973
512.0 mln
+3.0 mln
0.59%
jan 1, 1974
599.0 mln
+87.0 mln
16.99%
jan 1, 1975
111.0 mln
-488.0 mln
-81.47%
jan 1, 1976
128.0 mln
+17.0 mln
15.32%
jan 1, 1977
177.0 mln
+49.0 mln
38.28%
jan 1, 1978
180.0 mln
+3.0 mln
1.69%
jan 1, 1979
407.0 mln
+227.0 mln
126.11%
jan 1, 1980
786.0 mln
+379.0 mln
93.12%
jan 1, 1981
574.0 mln
-212.0 mln
-26.97%
jan 1, 1982
522.0 mln
-52.0 mln
-9.06%
jan 1, 1983
438.0 mln
-84.0 mln
-16.09%
jan 1, 1984
583.0 mln
+145.0 mln
33.11%
jan 1, 1985
575.0 mln
-8.0 mln
-1.37%
jan 1, 1986
294.0 mln
-281.0 mln
-48.87%
jan 1, 1987
98.0 mln
-196.0 mln
-66.67%
jan 1, 1988
106.0 mln
+8.0 mln
8.16%
jan 1, 1989
422.0 mln
+316.0 mln
298.11%
jan 1, 1990
218.0 mln
-204.0 mln
-48.34%
jan 1, 1991
320.0 mln
+102.0 mln
46.79%
jan 1, 1992
133.0 mln
-187.0 mln
-58.44%
jan 1, 1993
48.0 mln
-85.0 mln
-63.91%
jan 1, 1994
76.0 mln
+28.0 mln
58.33%
jan 1, 1995
49.0 mln
-27.0 mln
-35.53%
jan 1, 1996
16.0 mln
-33.0 mln
-67.35%
jan 1, 1997
3.0 mln
-13.0 mln
-81.25%
jan 1, 1998
53.0 mln
+50.0 mln
1.67K%
jan 1, 1999
55.0 mln
+2.0 mln
3.77%
jan 1, 2000
58.0 mln
+3.0 mln
5.45%
jan 1, 2001
35.0 mln
-23.0 mln
-39.66%
jan 1, 2002
29.0 mln
-6.0 mln
-17.14%
jan 1, 2003
56.0 mln
+27.0 mln
93.1%
jan 1, 2004
21.0 mln
-35.0 mln
-62.5%
jan 1, 2005
15.0 mln
-6.0 mln
-28.57%
jan 1, 2006
3.0 mln
-12.0 mln
-80.0%
jan 1, 2007
27.0 mln
+24.0 mln
800.0%
jan 1, 2008
174.0 mln
+147.0 mln
544.44%
jan 1, 2009
203.0 mln
+29.0 mln
16.67%
jan 1, 2010
90.0 mln
-113.0 mln
-55.67%
jan 1, 2011
32.0 mln
-58.0 mln
-64.44%
jan 1, 2012
21.0 mln
-11.0 mln
-34.38%
jan 1, 2013
32.0 mln
+11.0 mln
52.38%
jan 1, 2014
46.0 mln
+14.0 mln
43.75%
jan 1, 2015
103.0 mln
+57.0 mln
123.91%
jan 1, 2016
49.0 mln
-54.0 mln
-52.43%
Ranking of countries by current statistics by years


Comments: