29
/
en
AIzaSyAYiBZKx7MnpbEhh9jyipgxe19OcubqV5w
April 1, 2024
23915
Arab World
ARB
false
2
1
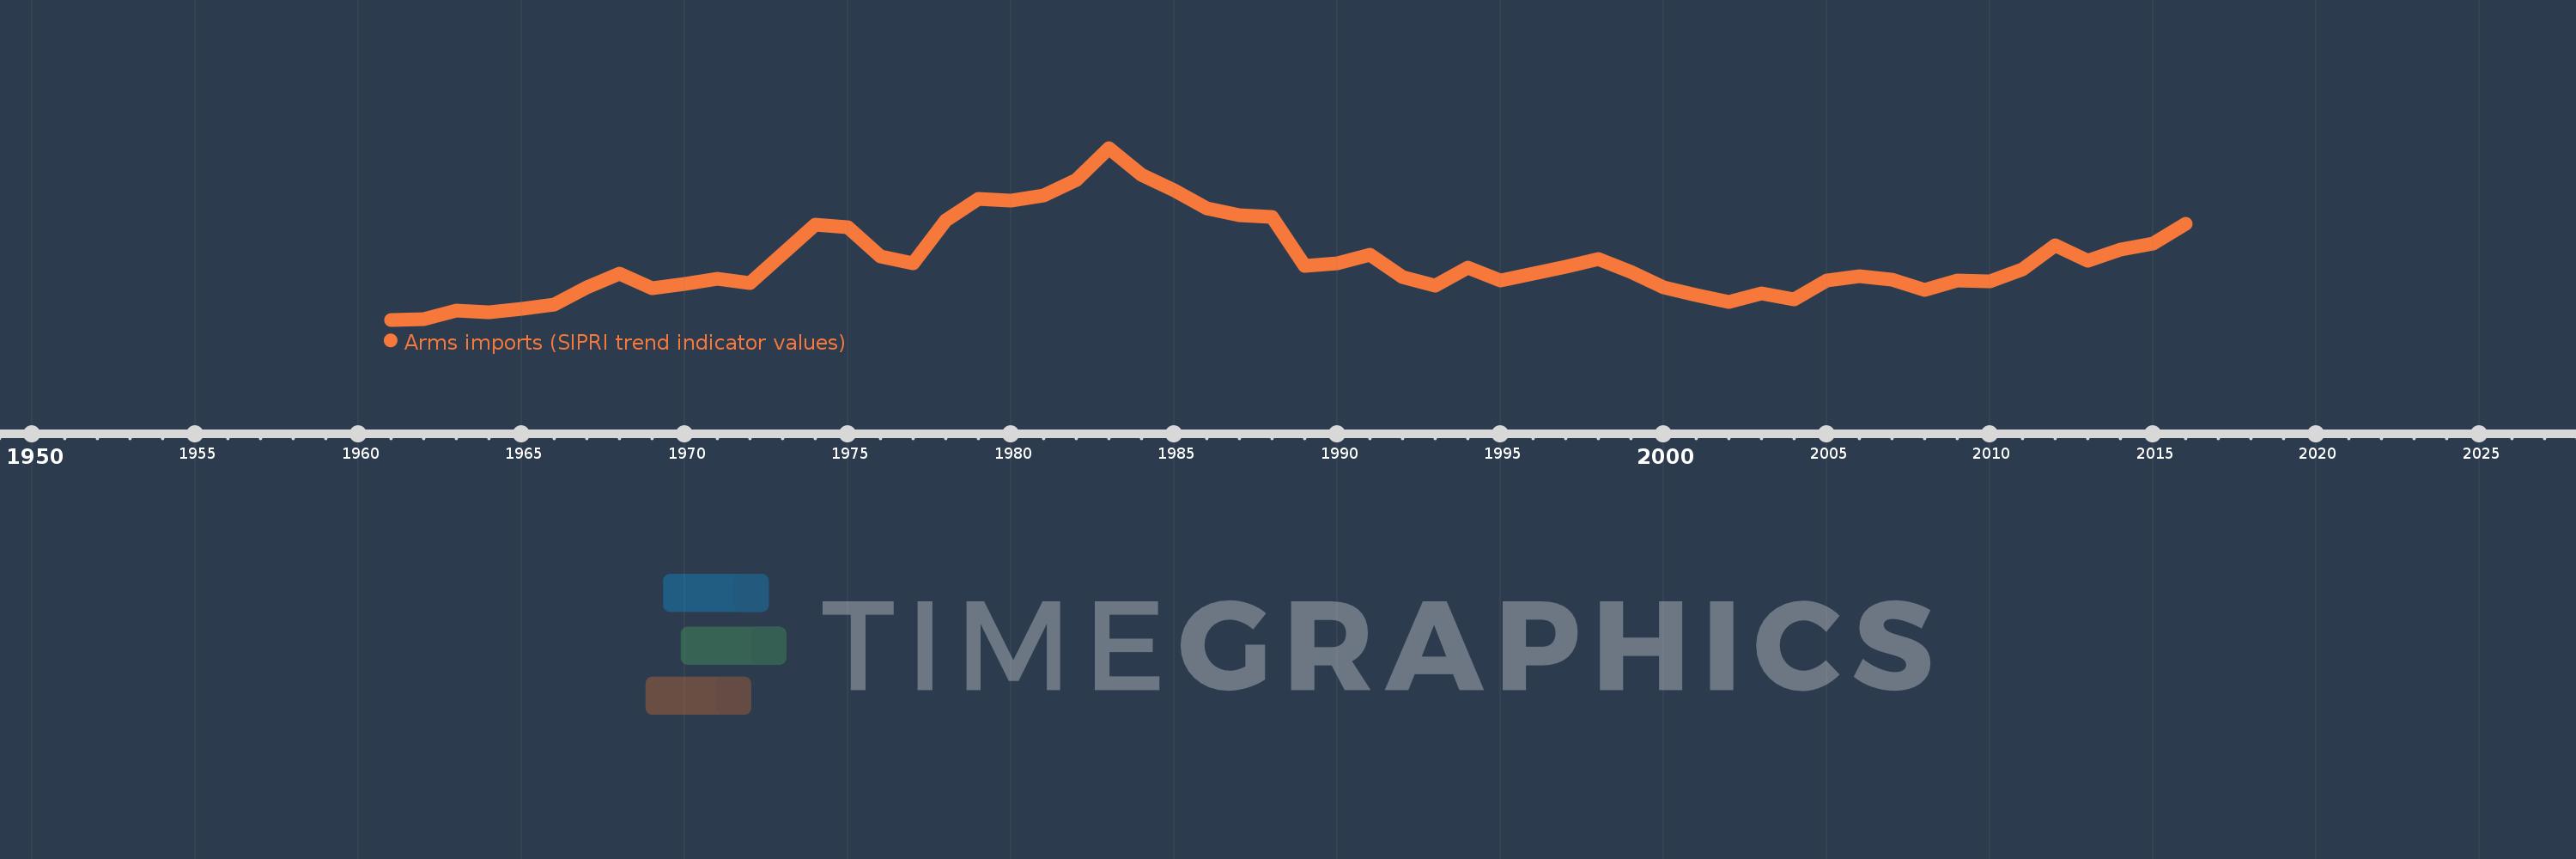
Arms imports (SIPRI trend indicator values)
2016,2015,2014,2013,2012,2011,2010,2009,2008,2007,2006,2005,2004,2003,2002,2001,2000,1999,1998,1997,1996,1995,1994,1993,1992,1991,1990,1989,1988,1987,1986,1985,1984,1983,1982,1981,1980,1979,1978,1977,1976,1975,1974,1973,1972,1971,1970,1969,1968,1967,1966,1965,1964,1963,1962,1961
This statistics in other country:
AfghanistanAlbaniaAlgeriaAngolaArab WorldArgentinaArmeniaAustraliaAustriaAzerbaijanBahamas, TheBahrainBangladeshBarbadosBelarusBelgiumBelizeBeninBhutanBoliviaBosnia and HerzegovinaBotswanaBrazilBrunei DarussalamBulgariaBurkina FasoBurundiCabo VerdeCambodiaCameroonCanadaCaribbean small statesCentral African RepublicCentral Europe and the BalticsChadChileChinaColombiaComorosCongo, Dem. Rep.Congo, Rep.Costa RicaCote d'IvoireCroatiaCubaCyprusCzech RepublicDenmarkDjiboutiDominican RepublicEarly-demographic dividendEast Asia & PacificEast Asia & Pacific (excluding high income)East Asia & Pacific (IDA & IBRD countries)EcuadorEgypt, Arab Rep.El SalvadorEquatorial GuineaEritreaEstoniaEthiopiaEuro areaEurope & Central AsiaEurope & Central Asia (excluding high income)Europe & Central Asia (IDA & IBRD countries)European UnionFijiFinlandFragile and conflict affected situationsFranceGabonGambia, TheGeorgiaGermanyGhanaGreeceGrenadaGuatemalaGuineaGuinea-BissauGuyanaHaitiHeavily indebted poor countries (HIPC)High incomeHondurasHungaryIBRD onlyIcelandIDA & IBRD totalIDA blendIDA onlyIDA totalIndiaIndonesiaIran, Islamic Rep.IraqIrelandIsraelItalyJamaicaJapanJordanKazakhstanKenyaKiribatiKorea, Dem. People’s Rep.Korea, Rep.KosovoKuwaitKyrgyz RepublicLao PDRLate-demographic dividendLatin America & Caribbean Latin America & Caribbean (excluding high income)Latin America & the Caribbean (IDA & IBRD countries)LatviaLeast developed countries: UN classificationLebanonLesothoLiberiaLibyaLithuaniaLow & middle incomeLow incomeLower middle incomeLuxembourgMacedonia, FYRMadagascarMalawiMalaysiaMaldivesMaliMaltaMarshall IslandsMauritaniaMauritiusMexicoMicronesia, Fed. Sts.Middle East & North AfricaMiddle East & North Africa (excluding high income)Middle East & North Africa (IDA & IBRD countries)Middle incomeMoldovaMongoliaMoroccoMozambiqueMyanmarNamibiaNepalNetherlandsNew ZealandNicaraguaNigerNigeriaNorth AmericaNorwayOECD membersOmanOther small statesPacific island small statesPakistanPalauPanamaPapua New GuineaParaguayPeruPhilippinesPolandPortugalPost-demographic dividendPre-demographic dividendQatarRomaniaRussian FederationRwandaSamoaSaudi ArabiaSenegalSerbiaSeychellesSierra LeoneSingaporeSlovak RepublicSloveniaSmall statesSolomon IslandsSomaliaSouth AfricaSouth AsiaSouth Asia (IDA & IBRD)South SudanSpainSri LankaSt. Kitts and NevisSt. Vincent and the GrenadinesSub-Saharan Africa Sub-Saharan Africa (excluding high income)Sub-Saharan Africa (IDA & IBRD countries)SudanSurinameSwazilandSwedenSwitzerlandSyrian Arab RepublicTajikistanTanzaniaThailandTimor-LesteTogoTongaTrinidad and TobagoTunisiaTurkeyTurkmenistanTuvaluUgandaUkraineUnited Arab EmiratesUnited KingdomUnited StatesUpper middle incomeUruguayUzbekistanVanuatuVenezuela, RBVietnamWest Bank and GazaWorldYemen, Rep.ZambiaZimbabwe Timeline:
This timeline shows a graph from 1961 to 2016 of Arab World. No data until 1960. Number of actual observations by date: 56.
Source name:
World Development Indicators
Source organization:
Stockholm International Peace Research Institute (SIPRI), Arms Transfers Programme (http://portal.sipri.org/publications/pages/transfer/splash).
Categories, topics:
Public Sector, Trade
Last updated:
apr 23, 2017
Indicators value changes by year
Minimum:
542.0 mln
jan 1, 1961
Maximum:
16.262 bln
jan 1, 1983
At the date of observation
Value
Absolute change
Change from previous value
jan 1, 1961
542.0 mln
+542.0 mln
0.0%
jan 1, 1962
580.0 mln
+38.0 mln
7.01%
jan 1, 1963
1.417 bln
+837.0 mln
144.31%
jan 1, 1964
1.265 bln
-152.0 mln
-10.73%
jan 1, 1965
1.525 bln
+260.0 mln
20.55%
jan 1, 1966
1.928 bln
+403.0 mln
26.43%
jan 1, 1967
3.468 bln
+1.54 bln
79.88%
jan 1, 1968
4.769 bln
+1.301 bln
37.51%
jan 1, 1969
3.416 bln
-1.353 bln
-28.37%
jan 1, 1970
3.84 bln
+424.0 mln
12.41%
jan 1, 1971
4.299 bln
+459.0 mln
11.95%
jan 1, 1972
3.934 bln
-365.0 mln
-8.49%
jan 1, 1973
6.574 bln
+2.64 bln
67.11%
jan 1, 1974
9.234 bln
+2.66 bln
40.46%
jan 1, 1975
9.016 bln
-218.0 mln
-2.36%
jan 1, 1976
6.317 bln
-2.699 bln
-29.94%
jan 1, 1977
5.714 bln
-603.0 mln
-9.55%
jan 1, 1978
9.623 bln
+3.909 bln
68.41%
jan 1, 1979
11.6 bln
+1.977 bln
20.54%
jan 1, 1980
11.415 bln
-185.0 mln
-1.59%
jan 1, 1981
11.915 bln
+500.0 mln
4.38%
jan 1, 1982
13.334 bln
+1.419 bln
11.91%
jan 1, 1983
16.262 bln
+2.928 bln
21.96%
jan 1, 1984
13.78 bln
-2.482 bln
-15.26%
jan 1, 1985
12.352 bln
-1.428 bln
-10.36%
jan 1, 1986
10.73 bln
-1.622 bln
-13.13%
jan 1, 1987
10.089 bln
-641.0 mln
-5.97%
jan 1, 1988
9.981 bln
-108.0 mln
-1.07%
jan 1, 1989
5.449 bln
-4.532 bln
-45.41%
jan 1, 1990
5.695 bln
+246.0 mln
4.51%
jan 1, 1991
6.473 bln
+778.0 mln
13.66%
jan 1, 1992
4.448 bln
-2.025 bln
-31.28%
jan 1, 1993
3.681 bln
-767.0 mln
-17.24%
jan 1, 1994
5.308 bln
+1.627 bln
44.2%
jan 1, 1995
4.168 bln
-1.14 bln
-21.48%
jan 1, 1996
4.725 bln
+557.0 mln
13.36%
jan 1, 1997
5.359 bln
+634.0 mln
13.42%
jan 1, 1998
6.108 bln
+749.0 mln
13.98%
jan 1, 1999
4.936 bln
-1.172 bln
-19.19%
jan 1, 2000
3.478 bln
-1.458 bln
-29.54%
jan 1, 2001
2.773 bln
-705.0 mln
-20.27%
jan 1, 2002
2.171 bln
-602.0 mln
-21.71%
jan 1, 2003
2.961 bln
+790.0 mln
36.39%
jan 1, 2004
2.406 bln
-555.0 mln
-18.74%
jan 1, 2005
4.147 bln
+1.741 bln
72.36%
jan 1, 2006
4.522 bln
+375.0 mln
9.04%
jan 1, 2007
4.232 bln
-290.0 mln
-6.41%
jan 1, 2008
3.248 bln
-984.0 mln
-23.25%
jan 1, 2009
4.131 bln
+883.0 mln
27.19%
jan 1, 2010
4.029 bln
-102.0 mln
-2.47%
jan 1, 2011
5.132 bln
+1.103 bln
27.38%
jan 1, 2012
7.348 bln
+2.216 bln
43.18%
jan 1, 2013
5.959 bln
-1.389 bln
-18.9%
jan 1, 2014
6.965 bln
+1.006 bln
16.88%
jan 1, 2015
7.492 bln
+527.0 mln
7.57%
jan 1, 2016
9.331 bln
+1.839 bln
24.55%
Ranking of countries by current statistics by years


Comments: