29
/
en
AIzaSyAYiBZKx7MnpbEhh9jyipgxe19OcubqV5w
April 1, 2024
51682
North America
NAC
false
2
1
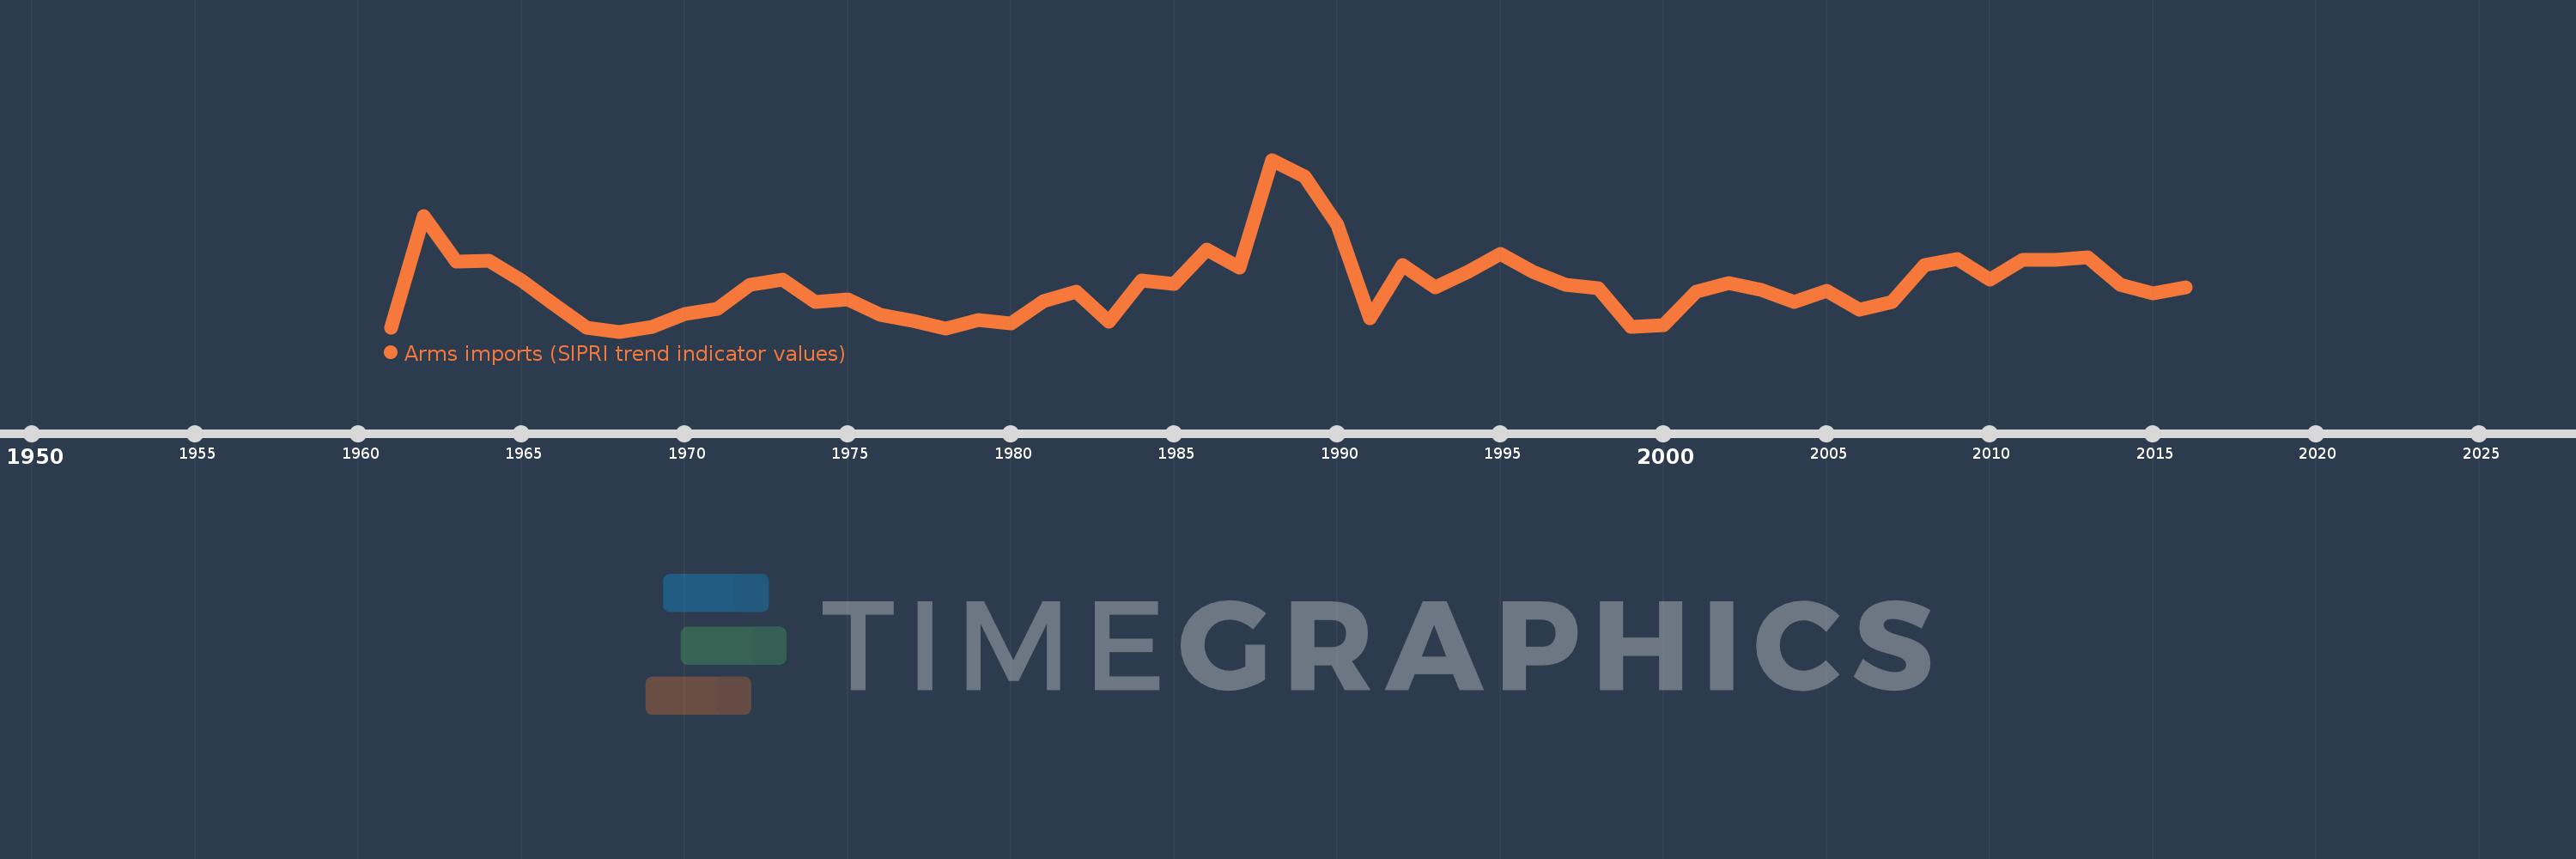
Arms imports (SIPRI trend indicator values)
2016,2015,2014,2013,2012,2011,2010,2009,2008,2007,2006,2005,2004,2003,2002,2001,2000,1999,1998,1997,1996,1995,1994,1993,1992,1991,1990,1989,1988,1987,1986,1985,1984,1983,1982,1981,1980,1979,1978,1977,1976,1975,1974,1973,1972,1971,1970,1969,1968,1967,1966,1965,1964,1963,1962,1961
This statistics in other country:
AfghanistanAlbaniaAlgeriaAngolaArab WorldArgentinaArmeniaAustraliaAustriaAzerbaijanBahamas, TheBahrainBangladeshBarbadosBelarusBelgiumBelizeBeninBhutanBoliviaBosnia and HerzegovinaBotswanaBrazilBrunei DarussalamBulgariaBurkina FasoBurundiCabo VerdeCambodiaCameroonCanadaCaribbean small statesCentral African RepublicCentral Europe and the BalticsChadChileChinaColombiaComorosCongo, Dem. Rep.Congo, Rep.Costa RicaCote d'IvoireCroatiaCubaCyprusCzech RepublicDenmarkDjiboutiDominican RepublicEarly-demographic dividendEast Asia & PacificEast Asia & Pacific (excluding high income)East Asia & Pacific (IDA & IBRD countries)EcuadorEgypt, Arab Rep.El SalvadorEquatorial GuineaEritreaEstoniaEthiopiaEuro areaEurope & Central AsiaEurope & Central Asia (excluding high income)Europe & Central Asia (IDA & IBRD countries)European UnionFijiFinlandFragile and conflict affected situationsFranceGabonGambia, TheGeorgiaGermanyGhanaGreeceGrenadaGuatemalaGuineaGuinea-BissauGuyanaHaitiHeavily indebted poor countries (HIPC)High incomeHondurasHungaryIBRD onlyIcelandIDA & IBRD totalIDA blendIDA onlyIDA totalIndiaIndonesiaIran, Islamic Rep.IraqIrelandIsraelItalyJamaicaJapanJordanKazakhstanKenyaKiribatiKorea, Dem. People’s Rep.Korea, Rep.KosovoKuwaitKyrgyz RepublicLao PDRLate-demographic dividendLatin America & Caribbean Latin America & Caribbean (excluding high income)Latin America & the Caribbean (IDA & IBRD countries)LatviaLeast developed countries: UN classificationLebanonLesothoLiberiaLibyaLithuaniaLow & middle incomeLow incomeLower middle incomeLuxembourgMacedonia, FYRMadagascarMalawiMalaysiaMaldivesMaliMaltaMarshall IslandsMauritaniaMauritiusMexicoMicronesia, Fed. Sts.Middle East & North AfricaMiddle East & North Africa (excluding high income)Middle East & North Africa (IDA & IBRD countries)Middle incomeMoldovaMongoliaMoroccoMozambiqueMyanmarNamibiaNepalNetherlandsNew ZealandNicaraguaNigerNigeriaNorth AmericaNorwayOECD membersOmanOther small statesPacific island small statesPakistanPalauPanamaPapua New GuineaParaguayPeruPhilippinesPolandPortugalPost-demographic dividendPre-demographic dividendQatarRomaniaRussian FederationRwandaSamoaSaudi ArabiaSenegalSerbiaSeychellesSierra LeoneSingaporeSlovak RepublicSloveniaSmall statesSolomon IslandsSomaliaSouth AfricaSouth AsiaSouth Asia (IDA & IBRD)South SudanSpainSri LankaSt. Kitts and NevisSt. Vincent and the GrenadinesSub-Saharan Africa Sub-Saharan Africa (excluding high income)Sub-Saharan Africa (IDA & IBRD countries)SudanSurinameSwazilandSwedenSwitzerlandSyrian Arab RepublicTajikistanTanzaniaThailandTimor-LesteTogoTongaTrinidad and TobagoTunisiaTurkeyTurkmenistanTuvaluUgandaUkraineUnited Arab EmiratesUnited KingdomUnited StatesUpper middle incomeUruguayUzbekistanVanuatuVenezuela, RBVietnamWest Bank and GazaWorldYemen, Rep.ZambiaZimbabwe Timeline:
This timeline shows a graph from 1961 to 2016 of North America. No data until 1960. Number of actual observations by date: 56.
Source name:
World Development Indicators
Source organization:
Stockholm International Peace Research Institute (SIPRI), Arms Transfers Programme (http://portal.sipri.org/publications/pages/transfer/splash).
Categories, topics:
Public Sector, Trade
Last updated:
apr 23, 2017
Indicators value changes by year
Minimum:
327.0 mln
jan 1, 1968
Maximum:
2.779 bln
jan 1, 1988
At the date of observation
Value
Absolute change
Change from previous value
jan 1, 1961
384.0 mln
+384.0 mln
0.0%
jan 1, 1962
1.98 bln
+1.596 bln
415.63%
jan 1, 1963
1.33 bln
-650.0 mln
-32.83%
jan 1, 1964
1.335 bln
+5.0 mln
0.38%
jan 1, 1965
1.054 bln
-281.0 mln
-21.05%
jan 1, 1966
717.0 mln
-337.0 mln
-31.97%
jan 1, 1967
382.0 mln
-335.0 mln
-46.72%
jan 1, 1968
327.0 mln
-55.0 mln
-14.4%
jan 1, 1969
394.0 mln
+67.0 mln
20.49%
jan 1, 1970
574.0 mln
+180.0 mln
45.69%
jan 1, 1971
657.0 mln
+83.0 mln
14.46%
jan 1, 1972
994.0 mln
+337.0 mln
51.29%
jan 1, 1973
1.063 bln
+69.0 mln
6.94%
jan 1, 1974
746.0 mln
-317.0 mln
-29.82%
jan 1, 1975
790.0 mln
+44.0 mln
5.9%
jan 1, 1976
568.0 mln
-222.0 mln
-28.1%
jan 1, 1977
477.0 mln
-91.0 mln
-16.02%
jan 1, 1978
365.0 mln
-112.0 mln
-23.48%
jan 1, 1979
493.0 mln
+128.0 mln
35.07%
jan 1, 1980
438.0 mln
-55.0 mln
-11.16%
jan 1, 1981
767.0 mln
+329.0 mln
75.11%
jan 1, 1982
903.0 mln
+136.0 mln
17.73%
jan 1, 1983
472.0 mln
-431.0 mln
-47.73%
jan 1, 1984
1.06 bln
+588.0 mln
124.58%
jan 1, 1985
1.007 bln
-53.0 mln
-5.0%
jan 1, 1986
1.502 bln
+495.0 mln
49.16%
jan 1, 1987
1.24 bln
-262.0 mln
-17.44%
jan 1, 1988
2.779 bln
+1.539 bln
124.11%
jan 1, 1989
2.535 bln
-244.0 mln
-8.78%
jan 1, 1990
1.852 bln
-683.0 mln
-26.94%
jan 1, 1991
516.0 mln
-1.336 bln
-72.14%
jan 1, 1992
1.274 bln
+758.0 mln
146.9%
jan 1, 1993
956.0 mln
-318.0 mln
-24.96%
jan 1, 1994
1.177 bln
+221.0 mln
23.12%
jan 1, 1995
1.436 bln
+259.0 mln
22.01%
jan 1, 1996
1.178 bln
-258.0 mln
-17.97%
jan 1, 1997
997.0 mln
-181.0 mln
-15.37%
jan 1, 1998
950.0 mln
-47.0 mln
-4.71%
jan 1, 1999
393.0 mln
-557.0 mln
-58.63%
jan 1, 2000
418.0 mln
+25.0 mln
6.36%
jan 1, 2001
900.0 mln
+482.0 mln
115.31%
jan 1, 2002
1.025 bln
+125.0 mln
13.89%
jan 1, 2003
927.0 mln
-98.0 mln
-9.56%
jan 1, 2004
744.0 mln
-183.0 mln
-19.74%
jan 1, 2005
912.0 mln
+168.0 mln
22.58%
jan 1, 2006
644.0 mln
-268.0 mln
-29.39%
jan 1, 2007
745.0 mln
+101.0 mln
15.68%
jan 1, 2008
1.275 bln
+530.0 mln
71.14%
jan 1, 2009
1.359 bln
+84.0 mln
6.59%
jan 1, 2010
1.074 bln
-285.0 mln
-20.97%
jan 1, 2011
1.347 bln
+273.0 mln
25.42%
jan 1, 2012
1.346 bln
-1000.0K
-0.07%
jan 1, 2013
1.391 bln
+45.0 mln
3.34%
jan 1, 2014
996.0 mln
-395.0 mln
-28.4%
jan 1, 2015
872.0 mln
-124.0 mln
-12.45%
jan 1, 2016
960.0 mln
+88.0 mln
10.09%
Ranking of countries by current statistics by years


Comments: