29
/
en
AIzaSyAYiBZKx7MnpbEhh9jyipgxe19OcubqV5w
April 1, 2024
30481
Europe & Central Asia
ECS
false
2
1
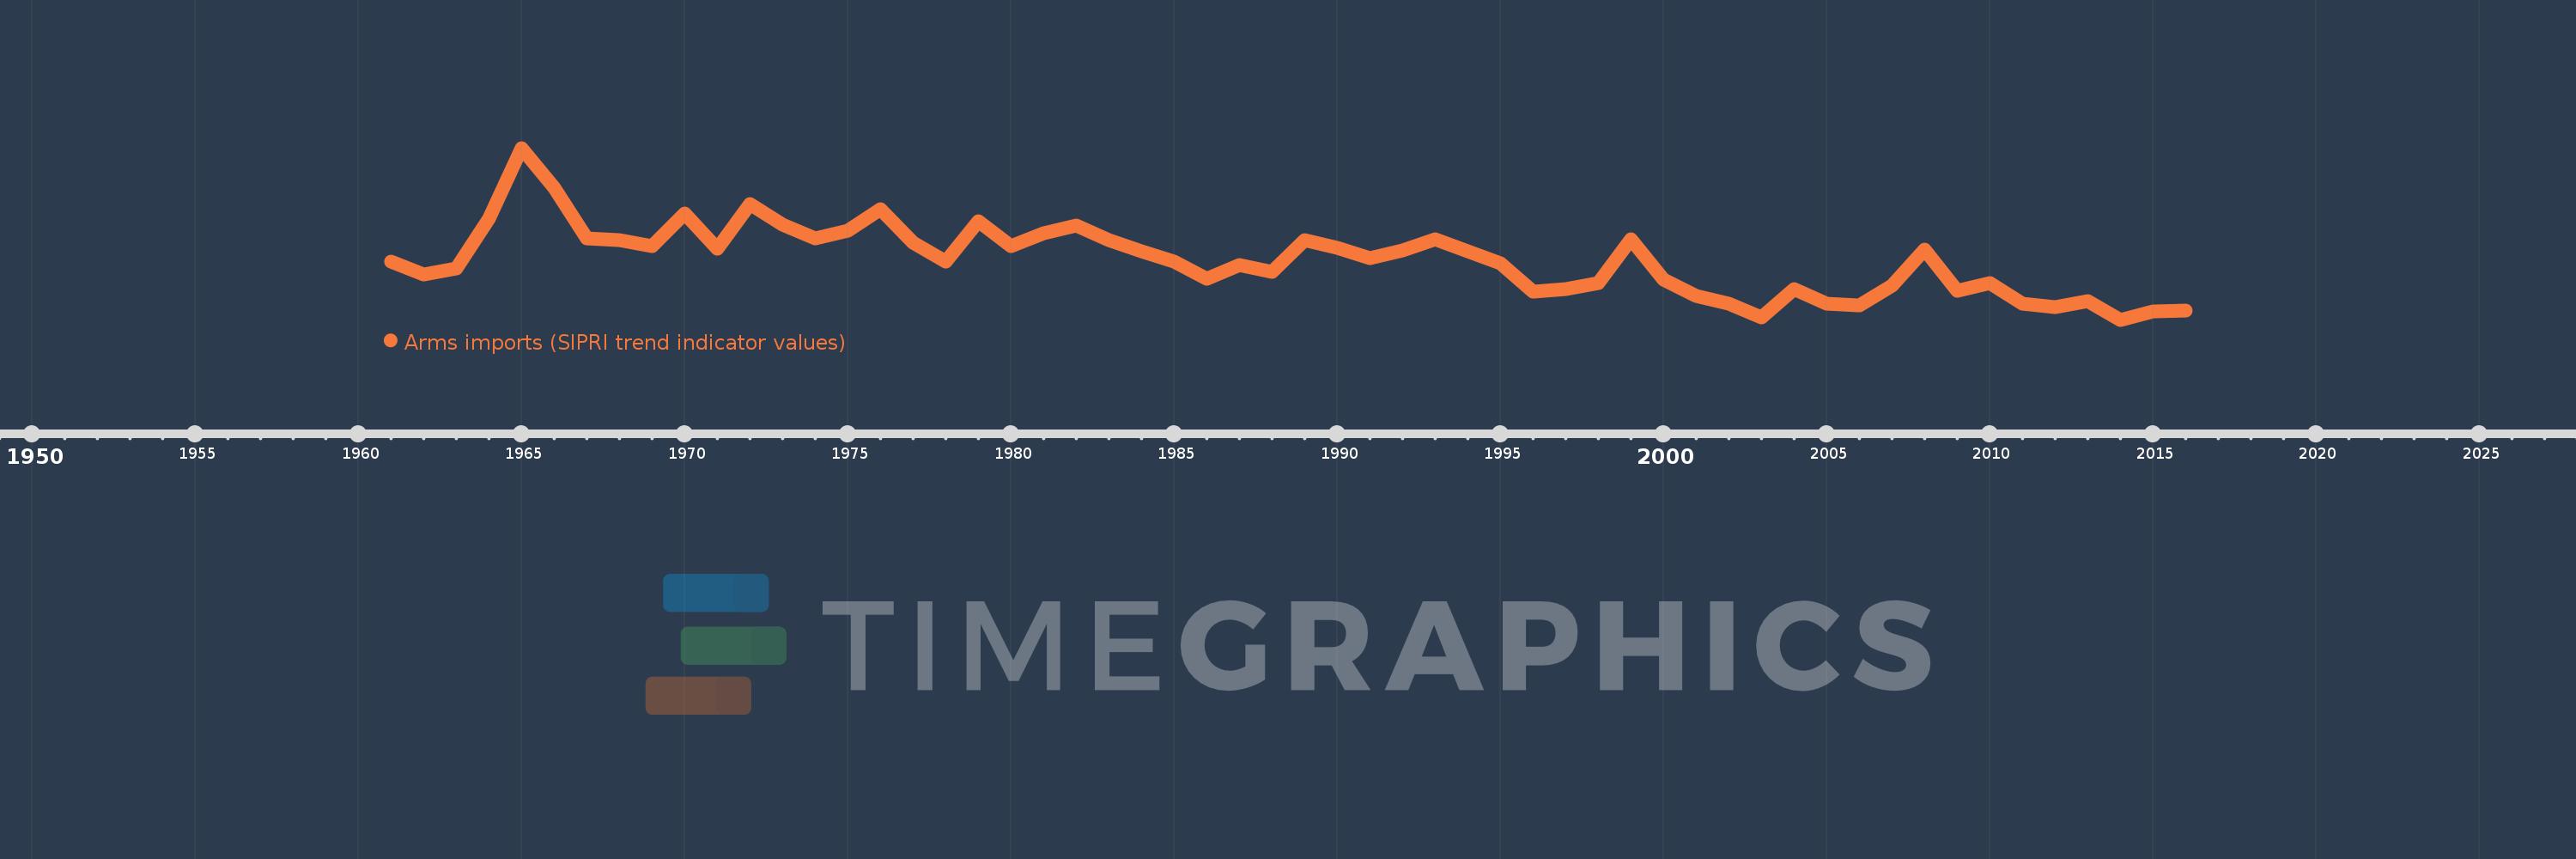
Arms imports (SIPRI trend indicator values)
2016,2015,2014,2013,2012,2011,2010,2009,2008,2007,2006,2005,2004,2003,2002,2001,2000,1999,1998,1997,1996,1995,1994,1993,1992,1991,1990,1989,1988,1987,1986,1985,1984,1983,1982,1981,1980,1979,1978,1977,1976,1975,1974,1973,1972,1971,1970,1969,1968,1967,1966,1965,1964,1963,1962,1961
This statistics in other country:
AfghanistanAlbaniaAlgeriaAngolaArab WorldArgentinaArmeniaAustraliaAustriaAzerbaijanBahamas, TheBahrainBangladeshBarbadosBelarusBelgiumBelizeBeninBhutanBoliviaBosnia and HerzegovinaBotswanaBrazilBrunei DarussalamBulgariaBurkina FasoBurundiCabo VerdeCambodiaCameroonCanadaCaribbean small statesCentral African RepublicCentral Europe and the BalticsChadChileChinaColombiaComorosCongo, Dem. Rep.Congo, Rep.Costa RicaCote d'IvoireCroatiaCubaCyprusCzech RepublicDenmarkDjiboutiDominican RepublicEarly-demographic dividendEast Asia & PacificEast Asia & Pacific (excluding high income)East Asia & Pacific (IDA & IBRD countries)EcuadorEgypt, Arab Rep.El SalvadorEquatorial GuineaEritreaEstoniaEthiopiaEuro areaEurope & Central AsiaEurope & Central Asia (excluding high income)Europe & Central Asia (IDA & IBRD countries)European UnionFijiFinlandFragile and conflict affected situationsFranceGabonGambia, TheGeorgiaGermanyGhanaGreeceGrenadaGuatemalaGuineaGuinea-BissauGuyanaHaitiHeavily indebted poor countries (HIPC)High incomeHondurasHungaryIBRD onlyIcelandIDA & IBRD totalIDA blendIDA onlyIDA totalIndiaIndonesiaIran, Islamic Rep.IraqIrelandIsraelItalyJamaicaJapanJordanKazakhstanKenyaKiribatiKorea, Dem. People’s Rep.Korea, Rep.KosovoKuwaitKyrgyz RepublicLao PDRLate-demographic dividendLatin America & Caribbean Latin America & Caribbean (excluding high income)Latin America & the Caribbean (IDA & IBRD countries)LatviaLeast developed countries: UN classificationLebanonLesothoLiberiaLibyaLithuaniaLow & middle incomeLow incomeLower middle incomeLuxembourgMacedonia, FYRMadagascarMalawiMalaysiaMaldivesMaliMaltaMarshall IslandsMauritaniaMauritiusMexicoMicronesia, Fed. Sts.Middle East & North AfricaMiddle East & North Africa (excluding high income)Middle East & North Africa (IDA & IBRD countries)Middle incomeMoldovaMongoliaMoroccoMozambiqueMyanmarNamibiaNepalNetherlandsNew ZealandNicaraguaNigerNigeriaNorth AmericaNorwayOECD membersOmanOther small statesPacific island small statesPakistanPalauPanamaPapua New GuineaParaguayPeruPhilippinesPolandPortugalPost-demographic dividendPre-demographic dividendQatarRomaniaRussian FederationRwandaSamoaSaudi ArabiaSenegalSerbiaSeychellesSierra LeoneSingaporeSlovak RepublicSloveniaSmall statesSolomon IslandsSomaliaSouth AfricaSouth AsiaSouth Asia (IDA & IBRD)South SudanSpainSri LankaSt. Kitts and NevisSt. Vincent and the GrenadinesSub-Saharan Africa Sub-Saharan Africa (excluding high income)Sub-Saharan Africa (IDA & IBRD countries)SudanSurinameSwazilandSwedenSwitzerlandSyrian Arab RepublicTajikistanTanzaniaThailandTimor-LesteTogoTongaTrinidad and TobagoTunisiaTurkeyTurkmenistanTuvaluUgandaUkraineUnited Arab EmiratesUnited KingdomUnited StatesUpper middle incomeUruguayUzbekistanVanuatuVenezuela, RBVietnamWest Bank and GazaWorldYemen, Rep.ZambiaZimbabwe Timeline:
This timeline shows a graph from 1961 to 2016 of Europe & Central Asia. No data until 1960. Number of actual observations by date: 56.
Source name:
World Development Indicators
Source organization:
Stockholm International Peace Research Institute (SIPRI), Arms Transfers Programme (http://portal.sipri.org/publications/pages/transfer/splash).
Categories, topics:
Public Sector, Trade
Last updated:
apr 23, 2017
Indicators value changes by year
Minimum:
3.691 bln
jan 1, 2014
Maximum:
14.082 bln
jan 1, 1965
At the date of observation
Value
Absolute change
Change from previous value
jan 1, 1961
7.202 bln
+7.202 bln
0.0%
jan 1, 1962
6.45 bln
-752.0 mln
-10.44%
jan 1, 1963
6.8 bln
+350.0 mln
5.43%
jan 1, 1964
9.798 bln
+2.998 bln
44.09%
jan 1, 1965
14.082 bln
+4.284 bln
43.72%
jan 1, 1966
11.666 bln
-2.416 bln
-17.16%
jan 1, 1967
8.605 bln
-3.061 bln
-26.24%
jan 1, 1968
8.531 bln
-74.0 mln
-0.86%
jan 1, 1969
8.151 bln
-380.0 mln
-4.45%
jan 1, 1970
10.131 bln
+1.98 bln
24.29%
jan 1, 1971
8.001 bln
-2.13 bln
-21.02%
jan 1, 1972
10.686 bln
+2.685 bln
33.56%
jan 1, 1973
9.437 bln
-1.249 bln
-11.69%
jan 1, 1974
8.589 bln
-848.0 mln
-8.99%
jan 1, 1975
9.096 bln
+507.0 mln
5.9%
jan 1, 1976
10.38 bln
+1.284 bln
14.12%
jan 1, 1977
8.372 bln
-2.008 bln
-19.34%
jan 1, 1978
7.228 bln
-1.144 bln
-13.66%
jan 1, 1979
9.656 bln
+2.428 bln
33.59%
jan 1, 1980
8.151 bln
-1.505 bln
-15.59%
jan 1, 1981
8.906 bln
+755.0 mln
9.26%
jan 1, 1982
9.379 bln
+473.0 mln
5.31%
jan 1, 1983
8.527 bln
-852.0 mln
-9.08%
jan 1, 1984
7.826 bln
-701.0 mln
-8.22%
jan 1, 1985
7.21 bln
-616.0 mln
-7.87%
jan 1, 1986
6.179 bln
-1.031 bln
-14.3%
jan 1, 1987
6.996 bln
+817.0 mln
13.22%
jan 1, 1988
6.577 bln
-419.0 mln
-5.99%
jan 1, 1989
8.498 bln
+1.921 bln
29.21%
jan 1, 1990
8.039 bln
-459.0 mln
-5.4%
jan 1, 1991
7.434 bln
-605.0 mln
-7.53%
jan 1, 1992
7.86 bln
+426.0 mln
5.73%
jan 1, 1993
8.578 bln
+718.0 mln
9.13%
jan 1, 1994
7.857 bln
-721.0 mln
-8.41%
jan 1, 1995
7.104 bln
-753.0 mln
-9.58%
jan 1, 1996
5.384 bln
-1.72 bln
-24.21%
jan 1, 1997
5.557 bln
+173.0 mln
3.21%
jan 1, 1998
5.884 bln
+327.0 mln
5.88%
jan 1, 1999
8.568 bln
+2.684 bln
45.62%
jan 1, 2000
6.143 bln
-2.425 bln
-28.3%
jan 1, 2001
5.115 bln
-1.028 bln
-16.73%
jan 1, 2002
4.687 bln
-428.0 mln
-8.37%
jan 1, 2003
3.833 bln
-854.0 mln
-18.22%
jan 1, 2004
5.57 bln
+1.737 bln
45.32%
jan 1, 2005
4.666 bln
-904.0 mln
-16.23%
jan 1, 2006
4.566 bln
-100.0 mln
-2.14%
jan 1, 2007
5.741 bln
+1.175 bln
25.73%
jan 1, 2008
7.927 bln
+2.186 bln
38.08%
jan 1, 2009
5.431 bln
-2.496 bln
-31.49%
jan 1, 2010
5.891 bln
+460.0 mln
8.47%
jan 1, 2011
4.687 bln
-1.204 bln
-20.44%
jan 1, 2012
4.44 bln
-247.0 mln
-5.27%
jan 1, 2013
4.835 bln
+395.0 mln
8.9%
jan 1, 2014
3.691 bln
-1.144 bln
-23.66%
jan 1, 2015
4.216 bln
+525.0 mln
14.22%
jan 1, 2016
4.258 bln
+42.0 mln
1.0%
Ranking of countries by current statistics by years


Comments: