29
/
en
AIzaSyAYiBZKx7MnpbEhh9jyipgxe19OcubqV5w
April 1, 2024
161229
Italy
ITA
true
2
1
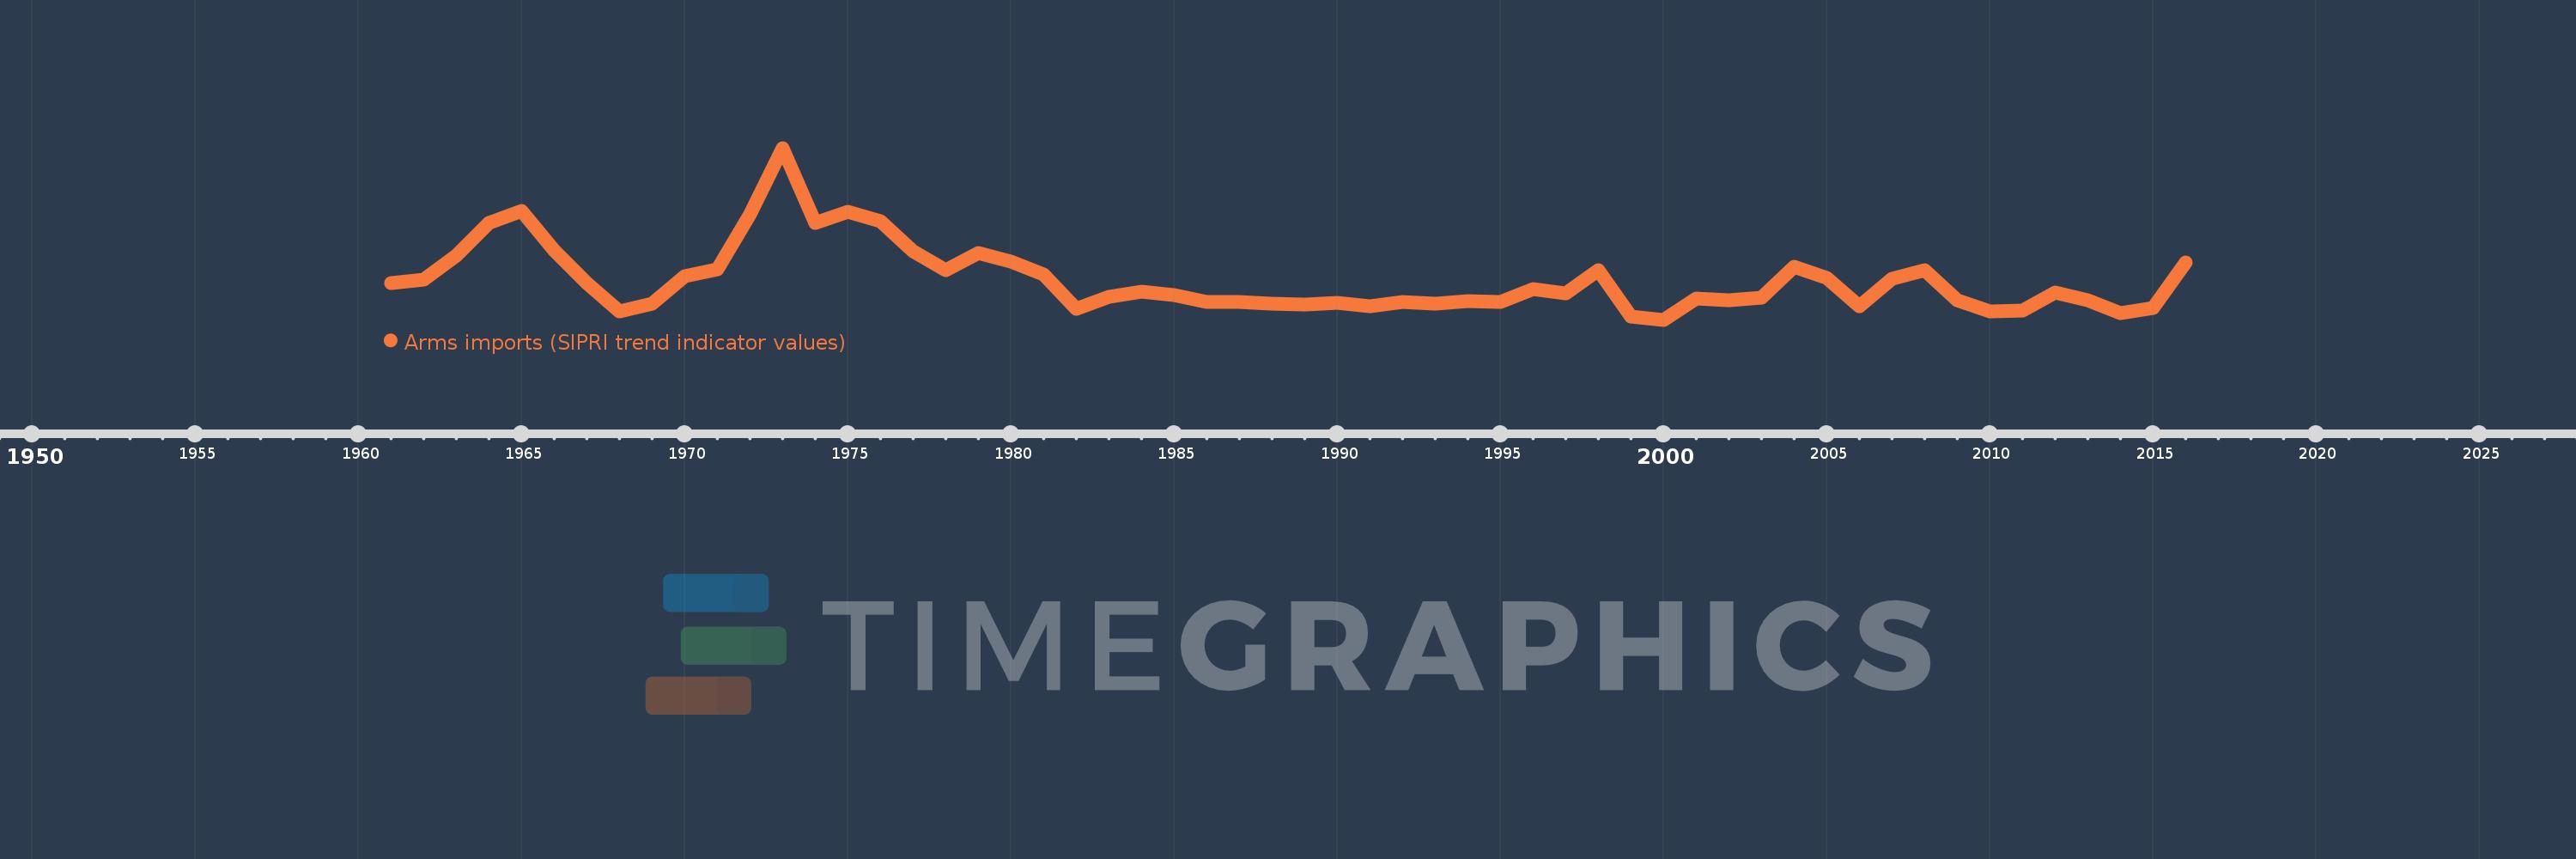
Arms imports (SIPRI trend indicator values)
2016,2015,2014,2013,2012,2011,2010,2009,2008,2007,2006,2005,2004,2003,2002,2001,2000,1999,1998,1997,1996,1995,1994,1993,1992,1991,1990,1989,1988,1987,1986,1985,1984,1983,1982,1981,1980,1979,1978,1977,1976,1975,1974,1973,1972,1971,1970,1969,1968,1967,1966,1965,1964,1963,1962,1961
This statistics in other country:
AfghanistanAlbaniaAlgeriaAngolaArab WorldArgentinaArmeniaAustraliaAustriaAzerbaijanBahamas, TheBahrainBangladeshBarbadosBelarusBelgiumBelizeBeninBhutanBoliviaBosnia and HerzegovinaBotswanaBrazilBrunei DarussalamBulgariaBurkina FasoBurundiCabo VerdeCambodiaCameroonCanadaCaribbean small statesCentral African RepublicCentral Europe and the BalticsChadChileChinaColombiaComorosCongo, Dem. Rep.Congo, Rep.Costa RicaCote d'IvoireCroatiaCubaCyprusCzech RepublicDenmarkDjiboutiDominican RepublicEarly-demographic dividendEast Asia & PacificEast Asia & Pacific (excluding high income)East Asia & Pacific (IDA & IBRD countries)EcuadorEgypt, Arab Rep.El SalvadorEquatorial GuineaEritreaEstoniaEthiopiaEuro areaEurope & Central AsiaEurope & Central Asia (excluding high income)Europe & Central Asia (IDA & IBRD countries)European UnionFijiFinlandFragile and conflict affected situationsFranceGabonGambia, TheGeorgiaGermanyGhanaGreeceGrenadaGuatemalaGuineaGuinea-BissauGuyanaHaitiHeavily indebted poor countries (HIPC)High incomeHondurasHungaryIBRD onlyIcelandIDA & IBRD totalIDA blendIDA onlyIDA totalIndiaIndonesiaIran, Islamic Rep.IraqIrelandIsraelItalyJamaicaJapanJordanKazakhstanKenyaKiribatiKorea, Dem. People’s Rep.Korea, Rep.KosovoKuwaitKyrgyz RepublicLao PDRLate-demographic dividendLatin America & Caribbean Latin America & Caribbean (excluding high income)Latin America & the Caribbean (IDA & IBRD countries)LatviaLeast developed countries: UN classificationLebanonLesothoLiberiaLibyaLithuaniaLow & middle incomeLow incomeLower middle incomeLuxembourgMacedonia, FYRMadagascarMalawiMalaysiaMaldivesMaliMaltaMarshall IslandsMauritaniaMauritiusMexicoMicronesia, Fed. Sts.Middle East & North AfricaMiddle East & North Africa (excluding high income)Middle East & North Africa (IDA & IBRD countries)Middle incomeMoldovaMongoliaMoroccoMozambiqueMyanmarNamibiaNepalNetherlandsNew ZealandNicaraguaNigerNigeriaNorth AmericaNorwayOECD membersOmanOther small statesPacific island small statesPakistanPalauPanamaPapua New GuineaParaguayPeruPhilippinesPolandPortugalPost-demographic dividendPre-demographic dividendQatarRomaniaRussian FederationRwandaSamoaSaudi ArabiaSenegalSerbiaSeychellesSierra LeoneSingaporeSlovak RepublicSloveniaSmall statesSolomon IslandsSomaliaSouth AfricaSouth AsiaSouth Asia (IDA & IBRD)South SudanSpainSri LankaSt. Kitts and NevisSt. Vincent and the GrenadinesSub-Saharan Africa Sub-Saharan Africa (excluding high income)Sub-Saharan Africa (IDA & IBRD countries)SudanSurinameSwazilandSwedenSwitzerlandSyrian Arab RepublicTajikistanTanzaniaThailandTimor-LesteTogoTongaTrinidad and TobagoTunisiaTurkeyTurkmenistanTuvaluUgandaUkraineUnited Arab EmiratesUnited KingdomUnited StatesUpper middle incomeUruguayUzbekistanVanuatuVenezuela, RBVietnamWest Bank and GazaWorldYemen, Rep.ZambiaZimbabwe Timeline:
This timeline shows a graph from 1961 to 2016 of Italy. No data until 1960. Number of actual observations by date: 56.
Source name:
World Development Indicators
Source organization:
Stockholm International Peace Research Institute (SIPRI), Arms Transfers Programme (http://portal.sipri.org/publications/pages/transfer/splash).
Categories, topics:
Public Sector, Trade
Last updated:
apr 23, 2017
Indicators value changes by year
Minimum:
25.0 mln
jan 1, 2000
Maximum:
1.746 bln
jan 1, 1973
At the date of observation
Value
Absolute change
Change from previous value
jan 1, 1961
390.0 mln
+390.0 mln
0.0%
jan 1, 1962
425.0 mln
+35.0 mln
8.97%
jan 1, 1963
666.0 mln
+241.0 mln
56.71%
jan 1, 1964
998.0 mln
+332.0 mln
49.85%
jan 1, 1965
1.114 bln
+116.0 mln
11.62%
jan 1, 1966
720.0 mln
-394.0 mln
-35.37%
jan 1, 1967
395.0 mln
-325.0 mln
-45.14%
jan 1, 1968
106.0 mln
-289.0 mln
-73.16%
jan 1, 1969
182.0 mln
+76.0 mln
71.7%
jan 1, 1970
457.0 mln
+275.0 mln
151.1%
jan 1, 1971
531.0 mln
+74.0 mln
16.19%
jan 1, 1972
1.078 bln
+547.0 mln
103.01%
jan 1, 1973
1.746 bln
+668.0 mln
61.97%
jan 1, 1974
999.0 mln
-747.0 mln
-42.78%
jan 1, 1975
1.108 bln
+109.0 mln
10.91%
jan 1, 1976
1.013 bln
-95.0 mln
-8.57%
jan 1, 1977
709.0 mln
-304.0 mln
-30.01%
jan 1, 1978
518.0 mln
-191.0 mln
-26.94%
jan 1, 1979
692.0 mln
+174.0 mln
33.59%
jan 1, 1980
605.0 mln
-87.0 mln
-12.57%
jan 1, 1981
479.0 mln
-126.0 mln
-20.83%
jan 1, 1982
133.0 mln
-346.0 mln
-72.23%
jan 1, 1983
251.0 mln
+118.0 mln
88.72%
jan 1, 1984
307.0 mln
+56.0 mln
22.31%
jan 1, 1985
273.0 mln
-34.0 mln
-11.07%
jan 1, 1986
206.0 mln
-67.0 mln
-24.54%
jan 1, 1987
199.0 mln
-7.0 mln
-3.4%
jan 1, 1988
183.0 mln
-16.0 mln
-8.04%
jan 1, 1989
179.0 mln
-4.0 mln
-2.19%
jan 1, 1990
196.0 mln
+17.0 mln
9.5%
jan 1, 1991
158.0 mln
-38.0 mln
-19.39%
jan 1, 1992
206.0 mln
+48.0 mln
30.38%
jan 1, 1993
188.0 mln
-18.0 mln
-8.74%
jan 1, 1994
208.0 mln
+20.0 mln
10.64%
jan 1, 1995
201.0 mln
-7.0 mln
-3.37%
jan 1, 1996
334.0 mln
+133.0 mln
66.17%
jan 1, 1997
286.0 mln
-48.0 mln
-14.37%
jan 1, 1998
519.0 mln
+233.0 mln
81.47%
jan 1, 1999
56.0 mln
-463.0 mln
-89.21%
jan 1, 2000
25.0 mln
-31.0 mln
-55.36%
jan 1, 2001
241.0 mln
+216.0 mln
864.0%
jan 1, 2002
221.0 mln
-20.0 mln
-8.3%
jan 1, 2003
243.0 mln
+22.0 mln
9.95%
jan 1, 2004
559.0 mln
+316.0 mln
130.04%
jan 1, 2005
446.0 mln
-113.0 mln
-20.21%
jan 1, 2006
162.0 mln
-284.0 mln
-63.68%
jan 1, 2007
433.0 mln
+271.0 mln
167.28%
jan 1, 2008
525.0 mln
+92.0 mln
21.25%
jan 1, 2009
220.0 mln
-305.0 mln
-58.1%
jan 1, 2010
109.0 mln
-111.0 mln
-50.45%
jan 1, 2011
115.0 mln
+6.0 mln
5.5%
jan 1, 2012
298.0 mln
+183.0 mln
159.13%
jan 1, 2013
219.0 mln
-79.0 mln
-26.51%
jan 1, 2014
91.0 mln
-128.0 mln
-58.45%
jan 1, 2015
145.0 mln
+54.0 mln
59.34%
jan 1, 2016
596.0 mln
+451.0 mln
311.03%
Ranking of countries by current statistics by years


Comments: