29
/
en
AIzaSyAYiBZKx7MnpbEhh9jyipgxe19OcubqV5w
April 1, 2024
63241
Afghanistan
AFG
true
2
1
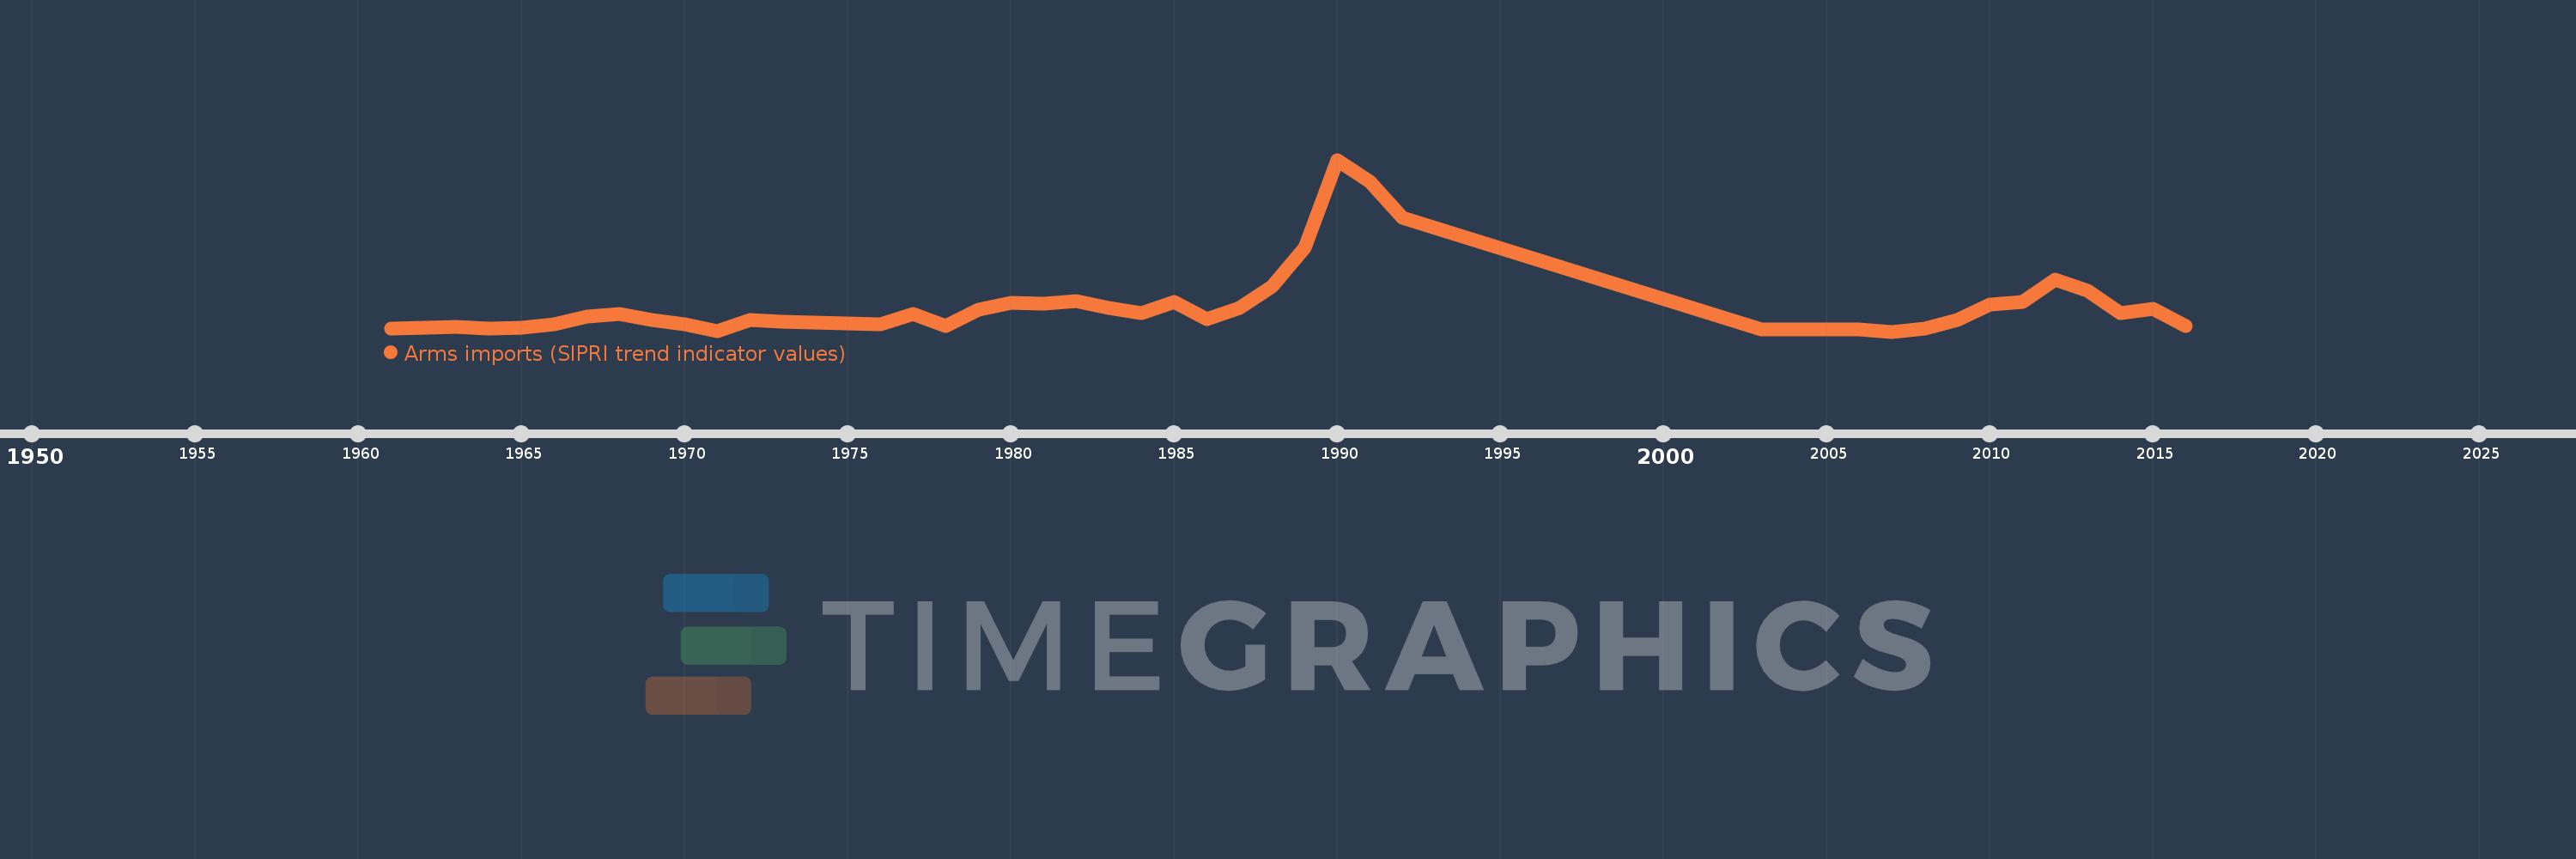
Arms imports (SIPRI trend indicator values)
2016,2015,2014,2013,2012,2011,2010,2009,2008,2007,2006,2003,1992,1991,1990,1989,1988,1987,1986,1985,1984,1983,1982,1981,1980,1979,1978,1977,1976,1973,1972,1971,1970,1969,1968,1967,1966,1965,1964,1963,1962,1961
This statistics in other country:
AfghanistanAlbaniaAlgeriaAngolaArab WorldArgentinaArmeniaAustraliaAustriaAzerbaijanBahamas, TheBahrainBangladeshBarbadosBelarusBelgiumBelizeBeninBhutanBoliviaBosnia and HerzegovinaBotswanaBrazilBrunei DarussalamBulgariaBurkina FasoBurundiCabo VerdeCambodiaCameroonCanadaCaribbean small statesCentral African RepublicCentral Europe and the BalticsChadChileChinaColombiaComorosCongo, Dem. Rep.Congo, Rep.Costa RicaCote d'IvoireCroatiaCubaCyprusCzech RepublicDenmarkDjiboutiDominican RepublicEarly-demographic dividendEast Asia & PacificEast Asia & Pacific (excluding high income)East Asia & Pacific (IDA & IBRD countries)EcuadorEgypt, Arab Rep.El SalvadorEquatorial GuineaEritreaEstoniaEthiopiaEuro areaEurope & Central AsiaEurope & Central Asia (excluding high income)Europe & Central Asia (IDA & IBRD countries)European UnionFijiFinlandFragile and conflict affected situationsFranceGabonGambia, TheGeorgiaGermanyGhanaGreeceGrenadaGuatemalaGuineaGuinea-BissauGuyanaHaitiHeavily indebted poor countries (HIPC)High incomeHondurasHungaryIBRD onlyIcelandIDA & IBRD totalIDA blendIDA onlyIDA totalIndiaIndonesiaIran, Islamic Rep.IraqIrelandIsraelItalyJamaicaJapanJordanKazakhstanKenyaKiribatiKorea, Dem. People’s Rep.Korea, Rep.KosovoKuwaitKyrgyz RepublicLao PDRLate-demographic dividendLatin America & Caribbean Latin America & Caribbean (excluding high income)Latin America & the Caribbean (IDA & IBRD countries)LatviaLeast developed countries: UN classificationLebanonLesothoLiberiaLibyaLithuaniaLow & middle incomeLow incomeLower middle incomeLuxembourgMacedonia, FYRMadagascarMalawiMalaysiaMaldivesMaliMaltaMarshall IslandsMauritaniaMauritiusMexicoMicronesia, Fed. Sts.Middle East & North AfricaMiddle East & North Africa (excluding high income)Middle East & North Africa (IDA & IBRD countries)Middle incomeMoldovaMongoliaMoroccoMozambiqueMyanmarNamibiaNepalNetherlandsNew ZealandNicaraguaNigerNigeriaNorth AmericaNorwayOECD membersOmanOther small statesPacific island small statesPakistanPalauPanamaPapua New GuineaParaguayPeruPhilippinesPolandPortugalPost-demographic dividendPre-demographic dividendQatarRomaniaRussian FederationRwandaSamoaSaudi ArabiaSenegalSerbiaSeychellesSierra LeoneSingaporeSlovak RepublicSloveniaSmall statesSolomon IslandsSomaliaSouth AfricaSouth AsiaSouth Asia (IDA & IBRD)South SudanSpainSri LankaSt. Kitts and NevisSt. Vincent and the GrenadinesSub-Saharan Africa Sub-Saharan Africa (excluding high income)Sub-Saharan Africa (IDA & IBRD countries)SudanSurinameSwazilandSwedenSwitzerlandSyrian Arab RepublicTajikistanTanzaniaThailandTimor-LesteTogoTongaTrinidad and TobagoTunisiaTurkeyTurkmenistanTuvaluUgandaUkraineUnited Arab EmiratesUnited KingdomUnited StatesUpper middle incomeUruguayUzbekistanVanuatuVenezuela, RBVietnamWest Bank and GazaWorldYemen, Rep.ZambiaZimbabwe Timeline:
This timeline shows a graph from 1961 to 2016 of Afghanistan. No data until 1960. Number of actual observations by date: 42.
Source name:
World Development Indicators
Source organization:
Stockholm International Peace Research Institute (SIPRI), Arms Transfers Programme (http://portal.sipri.org/publications/pages/transfer/splash).
Categories, topics:
Public Sector, Trade
Last updated:
apr 23, 2017
Indicators value changes by year
Minimum:
3.0 mln
jan 1, 2007
Maximum:
2.176 bln
jan 1, 1990
At the date of observation
Value
Absolute change
Change from previous value
jan 1, 1961
40.0 mln
+40.0 mln
0.0%
jan 1, 1962
56.0 mln
+16.0 mln
40.0%
jan 1, 1963
64.0 mln
+8.0 mln
14.29%
jan 1, 1964
40.0 mln
-24.0 mln
-37.5%
jan 1, 1965
56.0 mln
+16.0 mln
40.0%
jan 1, 1966
91.0 mln
+35.0 mln
62.5%
jan 1, 1967
198.0 mln
+107.0 mln
117.58%
jan 1, 1968
230.0 mln
+32.0 mln
16.16%
jan 1, 1969
145.0 mln
-85.0 mln
-36.96%
jan 1, 1970
92.0 mln
-53.0 mln
-36.55%
jan 1, 1971
9.0 mln
-83.0 mln
-90.22%
jan 1, 1972
149.0 mln
+140.0 mln
1.56K%
jan 1, 1973
124.0 mln
-25.0 mln
-16.78%
jan 1, 1976
90.0 mln
-34.0 mln
-27.42%
jan 1, 1977
230.0 mln
+140.0 mln
155.56%
jan 1, 1978
75.0 mln
-155.0 mln
-67.39%
jan 1, 1979
281.0 mln
+206.0 mln
274.67%
jan 1, 1980
362.0 mln
+81.0 mln
28.83%
jan 1, 1981
355.0 mln
-7.0 mln
-1.93%
jan 1, 1982
385.0 mln
+30.0 mln
8.45%
jan 1, 1983
298.0 mln
-87.0 mln
-22.6%
jan 1, 1984
239.0 mln
-59.0 mln
-19.8%
jan 1, 1985
380.0 mln
+141.0 mln
59.0%
jan 1, 1986
165.0 mln
-215.0 mln
-56.58%
jan 1, 1987
299.0 mln
+134.0 mln
81.21%
jan 1, 1988
575.0 mln
+276.0 mln
92.31%
jan 1, 1989
1.065 bln
+490.0 mln
85.22%
jan 1, 1990
2.176 bln
+1.111 bln
104.32%
jan 1, 1991
1.9 bln
-276.0 mln
-12.68%
jan 1, 1992
1.438 bln
-462.0 mln
-24.32%
jan 1, 2003
34.0 mln
-1.404 bln
-97.64%
jan 1, 2006
35.0 mln
+1000.0K
2.94%
jan 1, 2007
3.0 mln
-32.0 mln
-91.43%
jan 1, 2008
41.0 mln
+38.0 mln
1.27K%
jan 1, 2009
150.0 mln
+109.0 mln
265.85%
jan 1, 2010
344.0 mln
+194.0 mln
129.33%
jan 1, 2011
377.0 mln
+33.0 mln
9.59%
jan 1, 2012
660.0 mln
+283.0 mln
75.07%
jan 1, 2013
521.0 mln
-139.0 mln
-21.06%
jan 1, 2014
235.0 mln
-286.0 mln
-54.89%
jan 1, 2015
288.0 mln
+53.0 mln
22.55%
jan 1, 2016
74.0 mln
-214.0 mln
-74.31%
Ranking of countries by current statistics by years


Comments: