29
/
en
AIzaSyAYiBZKx7MnpbEhh9jyipgxe19OcubqV5w
April 1, 2024
61090
Sub-Saharan Africa (IDA & IBRD countries)
TSS
false
2
1
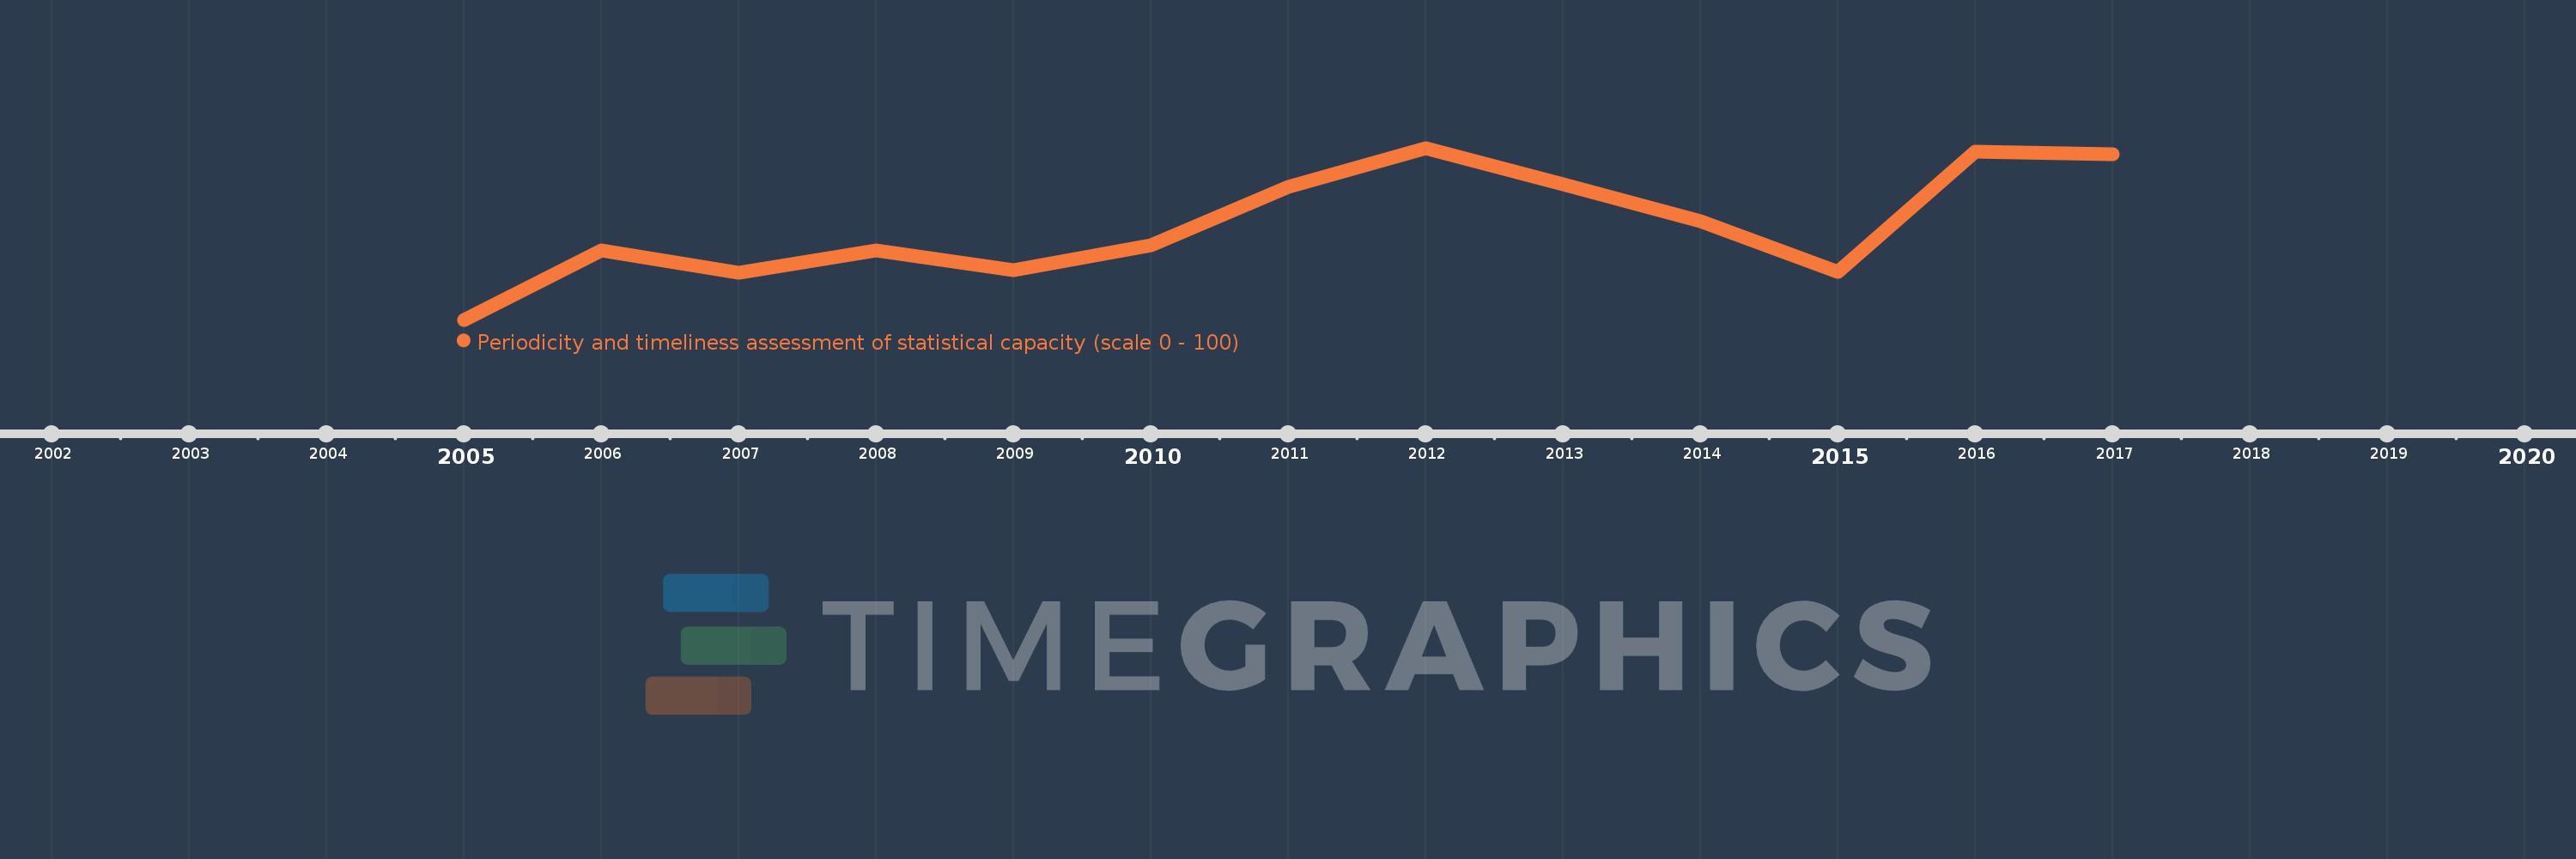
Periodicity and timeliness assessment of statistical capacity (scale 0 - 100)
2017,2016,2015,2014,2013,2012,2011,2010,2009,2008,2007,2006,2005
This statistics in other country:
Timeline:
This timeline shows a graph from 2005 to 2017 of Sub-Saharan Africa (IDA & IBRD countries). No data until 2004. Number of actual observations by date: 13.
Source name:
World Development Indicators
Source organization:
World Bank
Categories, topics:
Public Sector
Last updated:
apr 23, 2017
Indicators value changes by year
Minimum:
76.508
jan 1, 2005
Maximum:
81.429
jan 1, 2012
At the date of observation
Value
Absolute change
Change from previous value
jan 1, 2005
76.508
+76.508
0.0%
jan 1, 2006
78.492
+1.984
2.59%
jan 1, 2007
77.857
-0.635
-0.81%
jan 1, 2008
78.492
+0.635
0.82%
jan 1, 2009
77.937
-0.556
-0.71%
jan 1, 2010
78.651
+0.714
0.92%
jan 1, 2011
80.317
+1.667
2.12%
jan 1, 2012
81.429
+1.111
1.38%
jan 1, 2013
80.397
-1.032
-1.27%
jan 1, 2014
79.341
-1.056
-1.31%
jan 1, 2015
77.868
-1.473
-1.86%
jan 1, 2016
81.318
+3.45
4.43%
jan 1, 2017
81.24
-0.078
-0.1%
Ranking of countries by current statistics by years


Comments: