29
/
en
AIzaSyAYiBZKx7MnpbEhh9jyipgxe19OcubqV5w
April 1, 2024
56534
Small states
SST
false
2
1
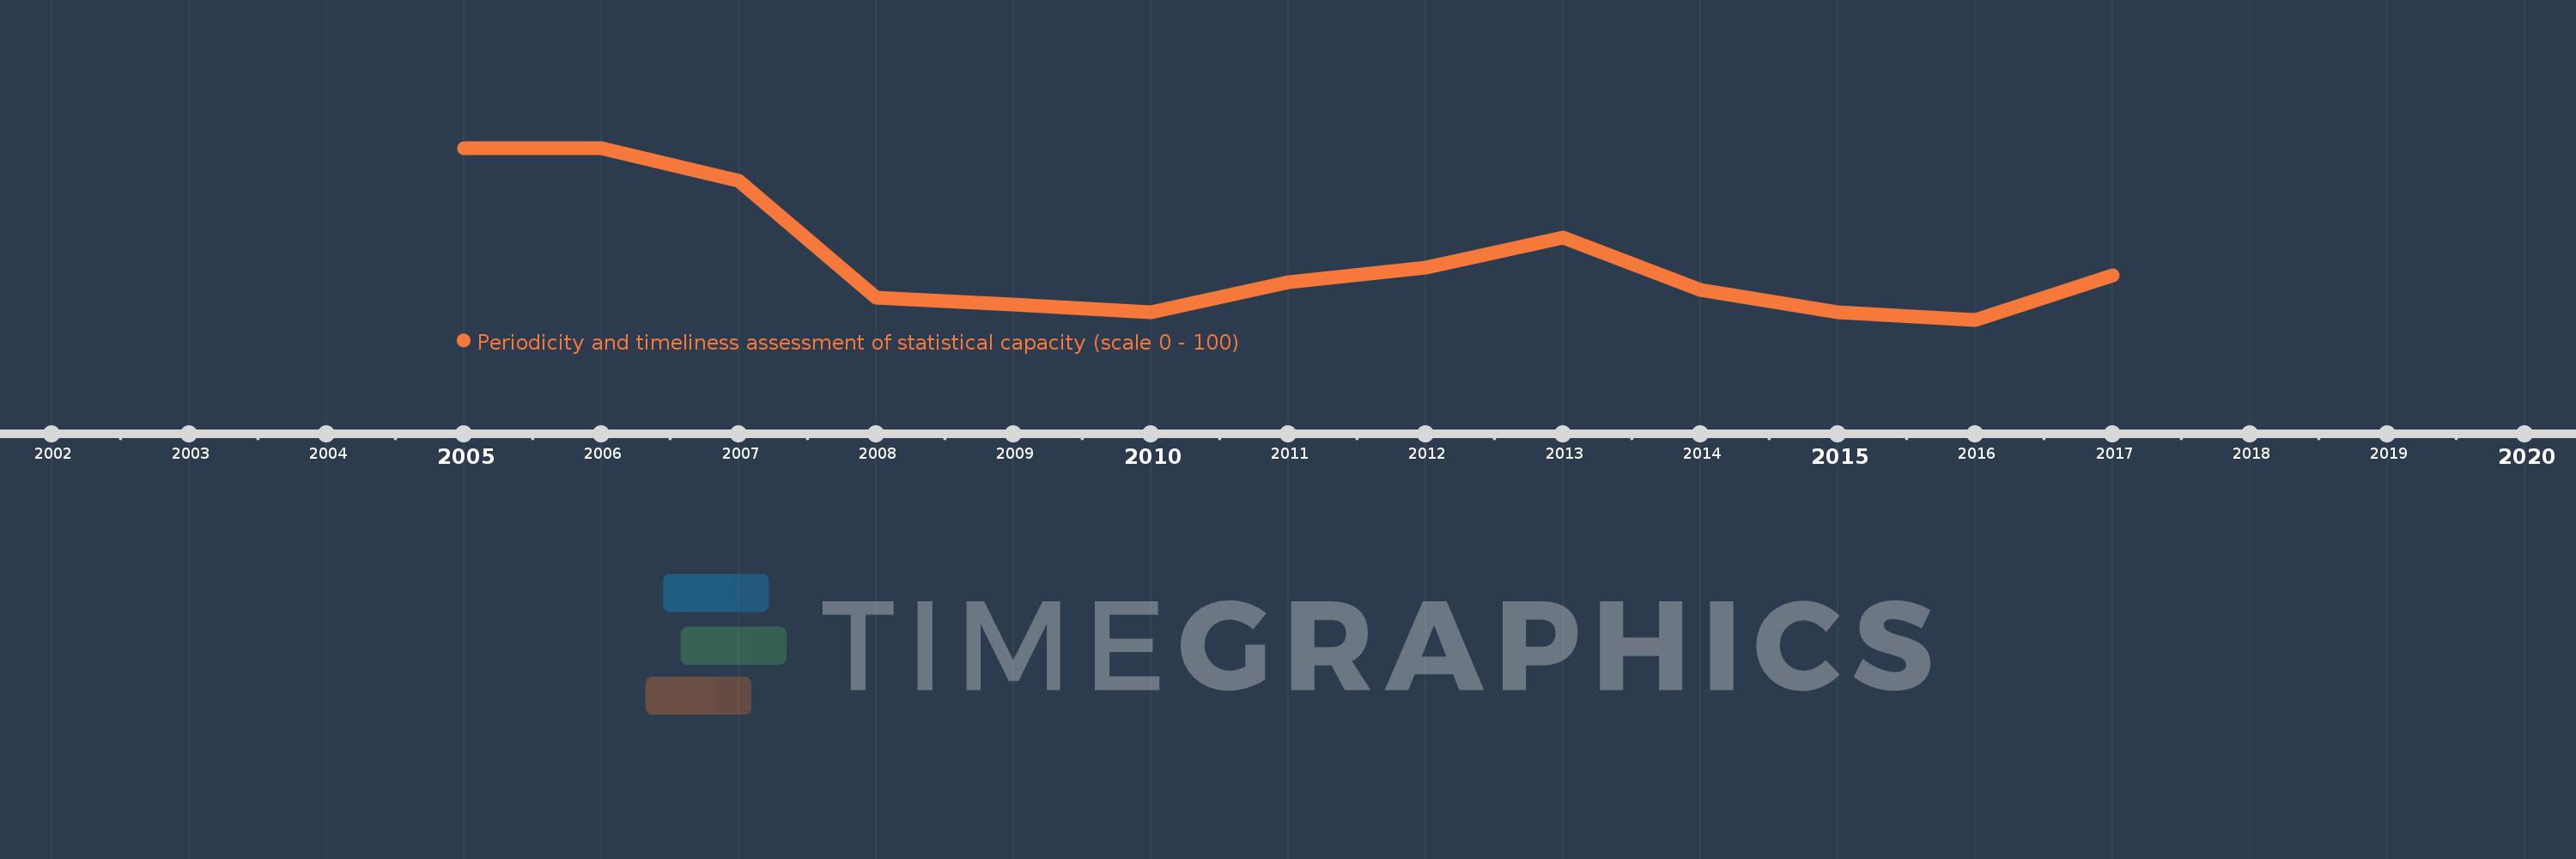
Periodicity and timeliness assessment of statistical capacity (scale 0 - 100)
2017,2016,2015,2014,2013,2012,2011,2010,2009,2008,2007,2006,2005
This statistics in other country:
Timeline:
This timeline shows a graph from 2005 to 2017 of Small states. No data until 2004. Number of actual observations by date: 13.
Source name:
World Development Indicators
Source organization:
World Bank
Categories, topics:
Public Sector
Last updated:
apr 23, 2017
Indicators value changes by year
At the date of observation
Value
Absolute change
Change from previous value
jan 1, 2005
80.0
+80.0
0.0%
jan 1, 2007
78.667
-1.333
-1.67%
jan 1, 2008
73.939
-4.727
-6.01%
jan 1, 2009
73.636
-0.303
-0.41%
jan 1, 2010
73.333
-0.303
-0.41%
jan 1, 2011
74.545
+1.212
1.65%
jan 1, 2012
75.152
+0.606
0.81%
jan 1, 2013
76.364
+1.212
1.61%
jan 1, 2014
74.242
-2.121
-2.78%
jan 1, 2015
73.333
-0.909
-1.22%
jan 1, 2016
73.03
-0.303
-0.41%
jan 1, 2017
74.848
+1.818
2.49%
Ranking of countries by current statistics by years


Comments: