29
/
en
AIzaSyAYiBZKx7MnpbEhh9jyipgxe19OcubqV5w
April 1, 2024
31984
Europe & Central Asia (excluding high income)
ECA
false
2
1
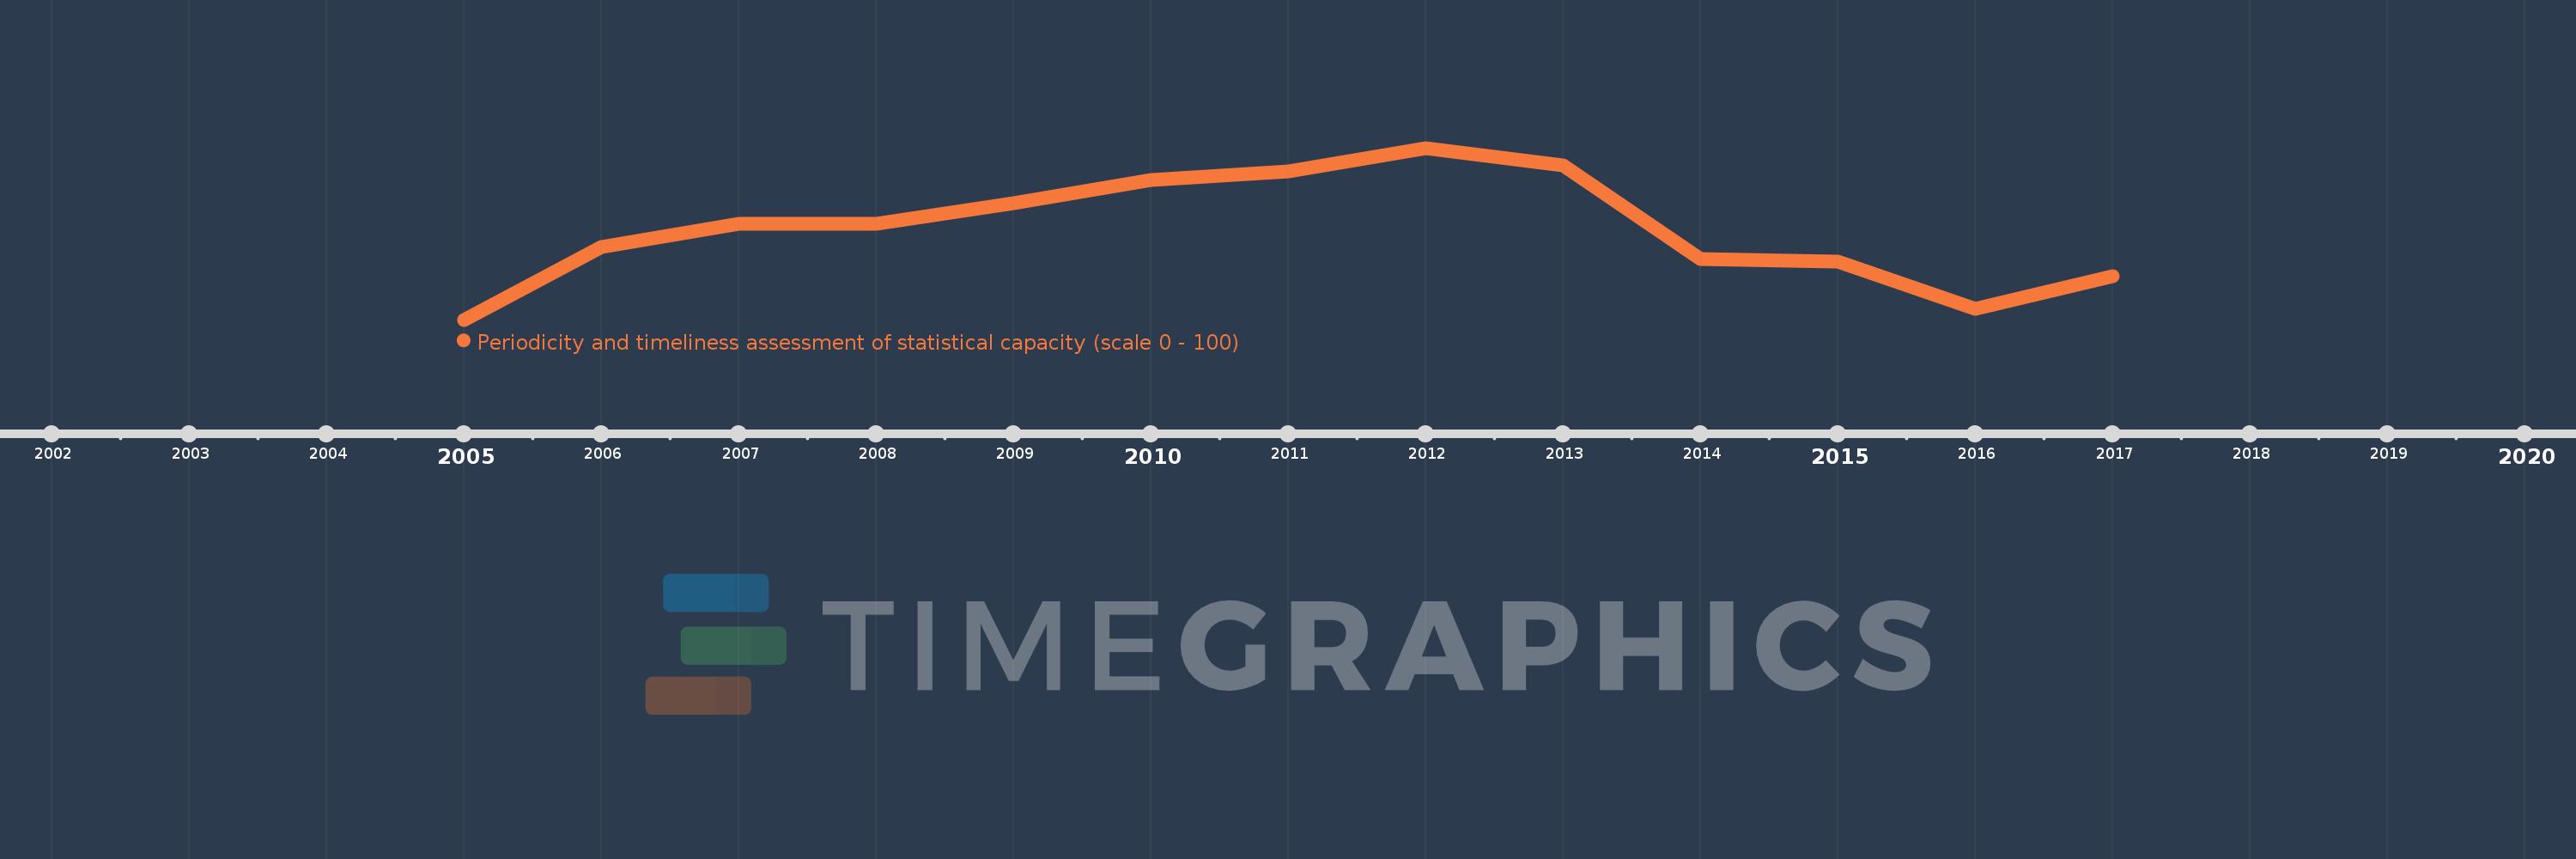
Periodicity and timeliness assessment of statistical capacity (scale 0 - 100)
2017,2016,2015,2014,2013,2012,2011,2010,2009,2008,2007,2006,2005
This statistics in other country:
Timeline:
This timeline shows a graph from 2005 to 2017 of Europe & Central Asia (excluding high income). No data until 2004. Number of actual observations by date: 13.
Source name:
World Development Indicators
Source organization:
World Bank
Categories, topics:
Public Sector
Last updated:
apr 23, 2017
Indicators value changes by year
Minimum:
77.193
jan 1, 2005
Maximum:
87.544
jan 1, 2012
At the date of observation
Value
Absolute change
Change from previous value
jan 1, 2005
77.193
+77.193
0.0%
jan 1, 2006
81.579
+4.386
5.68%
jan 1, 2007
82.982
+1.404
1.72%
jan 1, 2008
82.982
0.0
0.0%
jan 1, 2009
84.21
+1.228
1.48%
jan 1, 2010
85.614
+1.404
1.67%
jan 1, 2011
86.14
+0.526
0.61%
jan 1, 2012
87.544
+1.404
1.63%
jan 1, 2013
86.491
-1.053
-1.2%
jan 1, 2014
80.833
-5.658
-6.54%
jan 1, 2015
80.683
-0.15
-0.19%
jan 1, 2016
77.833
-2.85
-3.53%
jan 1, 2017
79.833
+2.0
2.57%
Ranking of countries by current statistics by years


Comments: