29
/
en
AIzaSyAYiBZKx7MnpbEhh9jyipgxe19OcubqV5w
April 1, 2024
247043
South Sudan
SSD
true
2
1
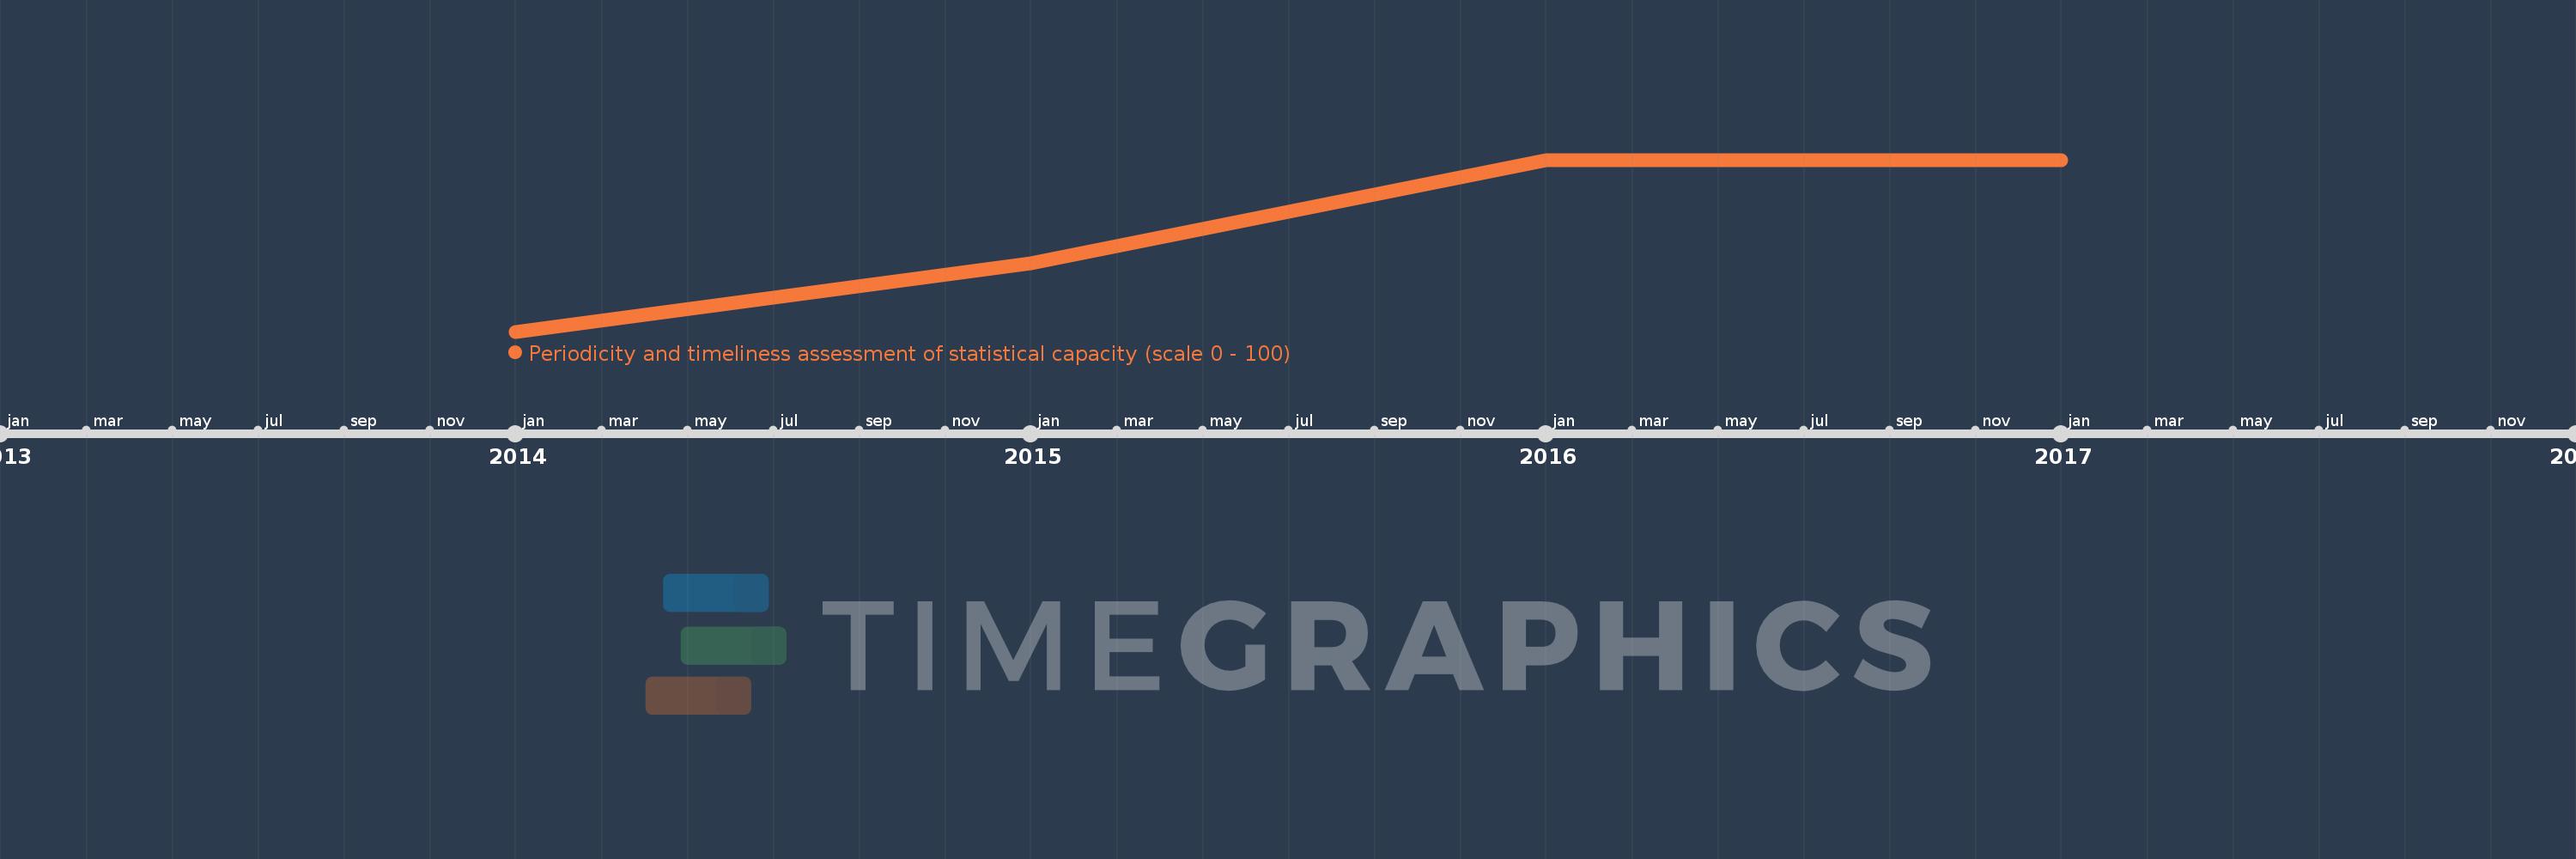
Periodicity and timeliness assessment of statistical capacity (scale 0 - 100)
2017,2016,2015,2014
This statistics in other country:
Timeline:
This timeline shows a graph from 2014 to 2017 of South Sudan. No data until 2013. Number of actual observations by date: 4.
Source name:
World Development Indicators
Source organization:
World Bank
Categories, topics:
Public Sector
Last updated:
apr 23, 2017
Indicators value changes by year
Minimum:
28.333
jan 1, 2014
Maximum:
53.333
jan 1, 2016
At the date of observation
Value
Absolute change
Change from previous value
jan 1, 2014
28.333
+28.333
0.0%
jan 1, 2015
38.333
+10.0
35.29%
jan 1, 2016
53.333
+15.0
39.13%
jan 1, 2017
53.333
0.0
0.0%
Ranking of countries by current statistics by years


Comments: