29
/
en
AIzaSyAYiBZKx7MnpbEhh9jyipgxe19OcubqV5w
April 1, 2024
36896
IBRD only
IBD
false
2
1
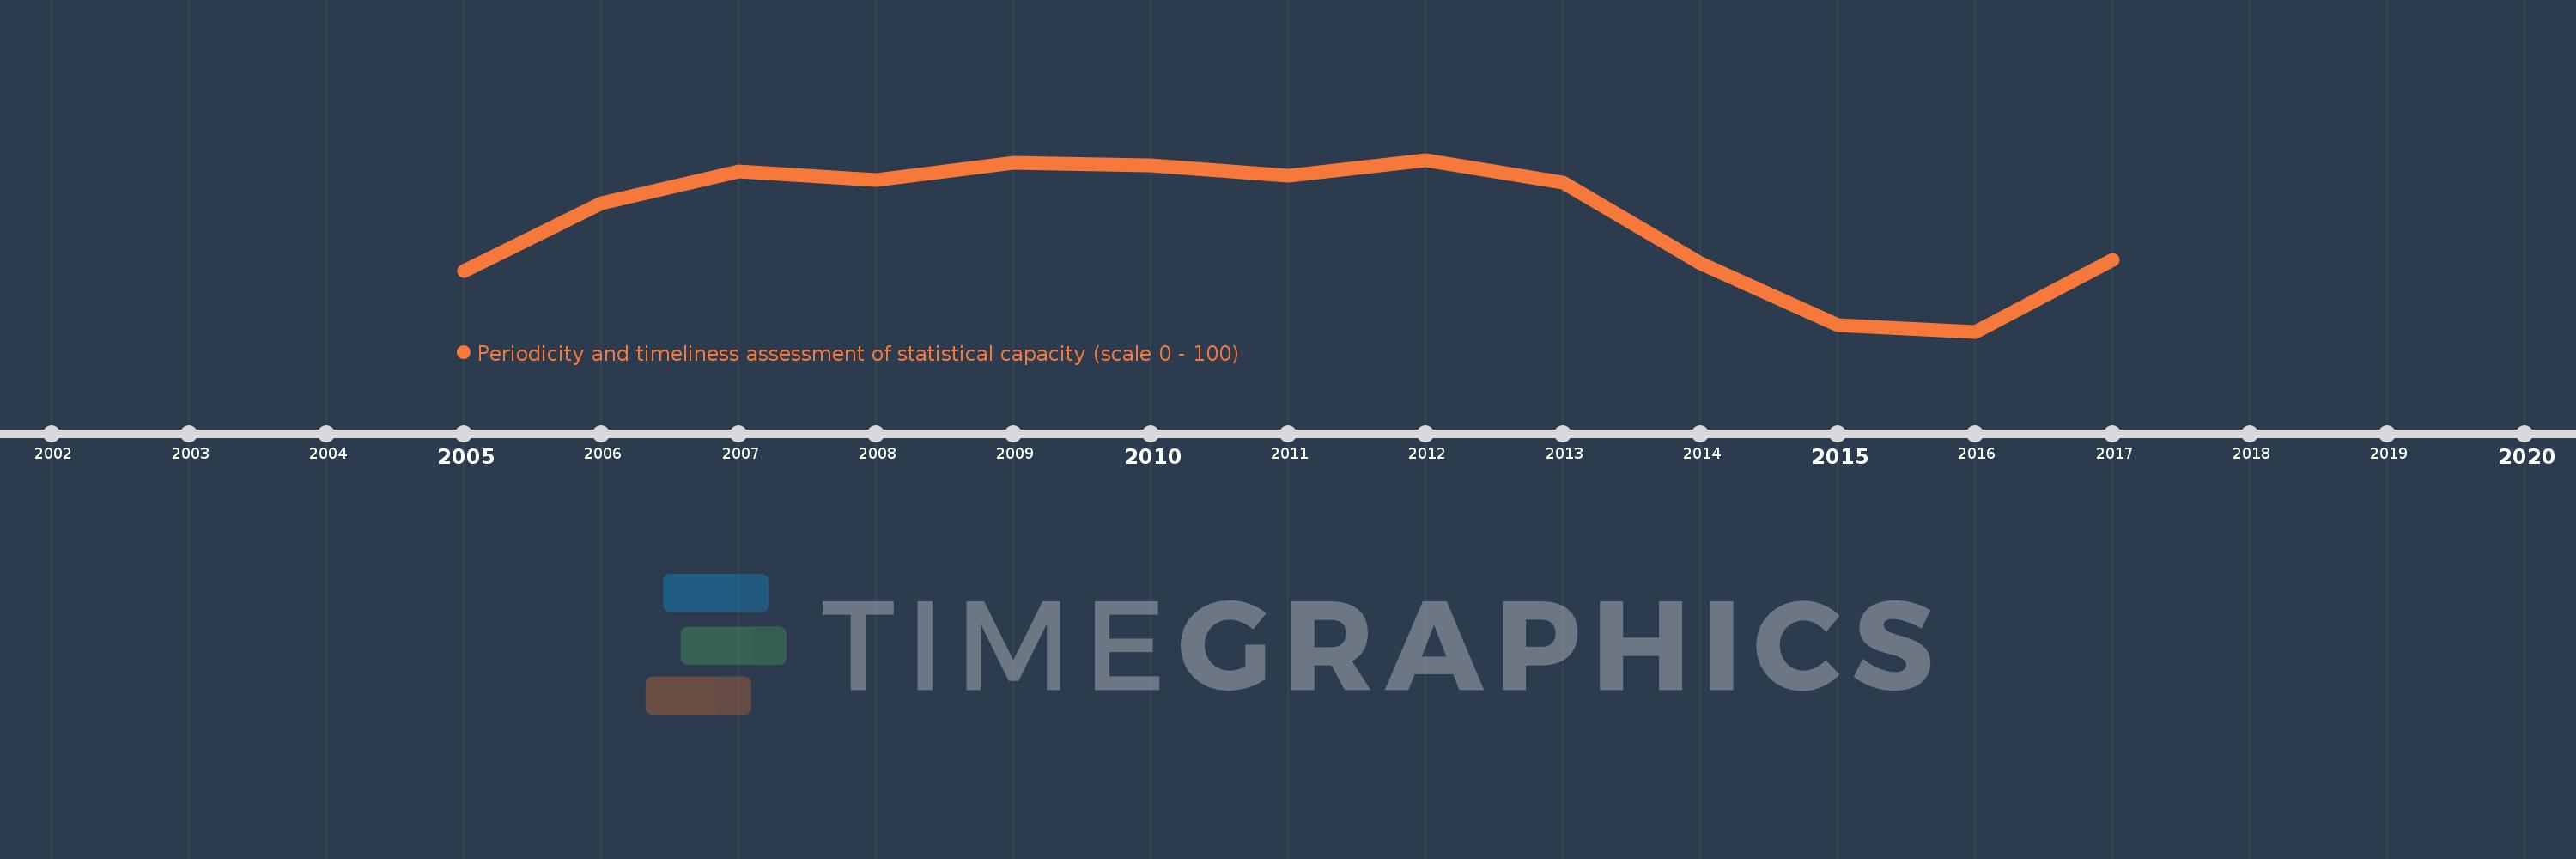
Periodicity and timeliness assessment of statistical capacity (scale 0 - 100)
2017,2016,2015,2014,2013,2012,2011,2010,2009,2008,2007,2006,2005
This statistics in other country:
Timeline:
This timeline shows a graph from 2005 to 2017 of IBRD only. No data until 2004. Number of actual observations by date: 13.
Source name:
World Development Indicators
Source organization:
World Bank
Categories, topics:
Public Sector
Last updated:
apr 23, 2017
Indicators value changes by year
Minimum:
80.655
jan 1, 2016
Maximum:
84.226
jan 1, 2012
At the date of observation
Value
Absolute change
Change from previous value
jan 1, 2005
81.905
+81.905
0.0%
jan 1, 2006
83.333
+1.428
1.74%
jan 1, 2007
83.988
+0.655
0.79%
jan 1, 2008
83.809
-0.179
-0.21%
jan 1, 2009
84.167
+0.357
0.43%
jan 1, 2010
84.107
-0.06
-0.07%
jan 1, 2011
83.899
-0.208
-0.25%
jan 1, 2012
84.226
+0.327
0.39%
jan 1, 2013
83.75
-0.476
-0.57%
jan 1, 2014
82.083
-1.667
-1.99%
jan 1, 2015
80.78
-1.304
-1.59%
jan 1, 2016
80.655
-0.125
-0.15%
jan 1, 2017
82.143
+1.488
1.85%
Ranking of countries by current statistics by years


Comments: