29
/
en
AIzaSyAYiBZKx7MnpbEhh9jyipgxe19OcubqV5w
April 1, 2024
55791
Pre-demographic dividend
PRE
false
2
1
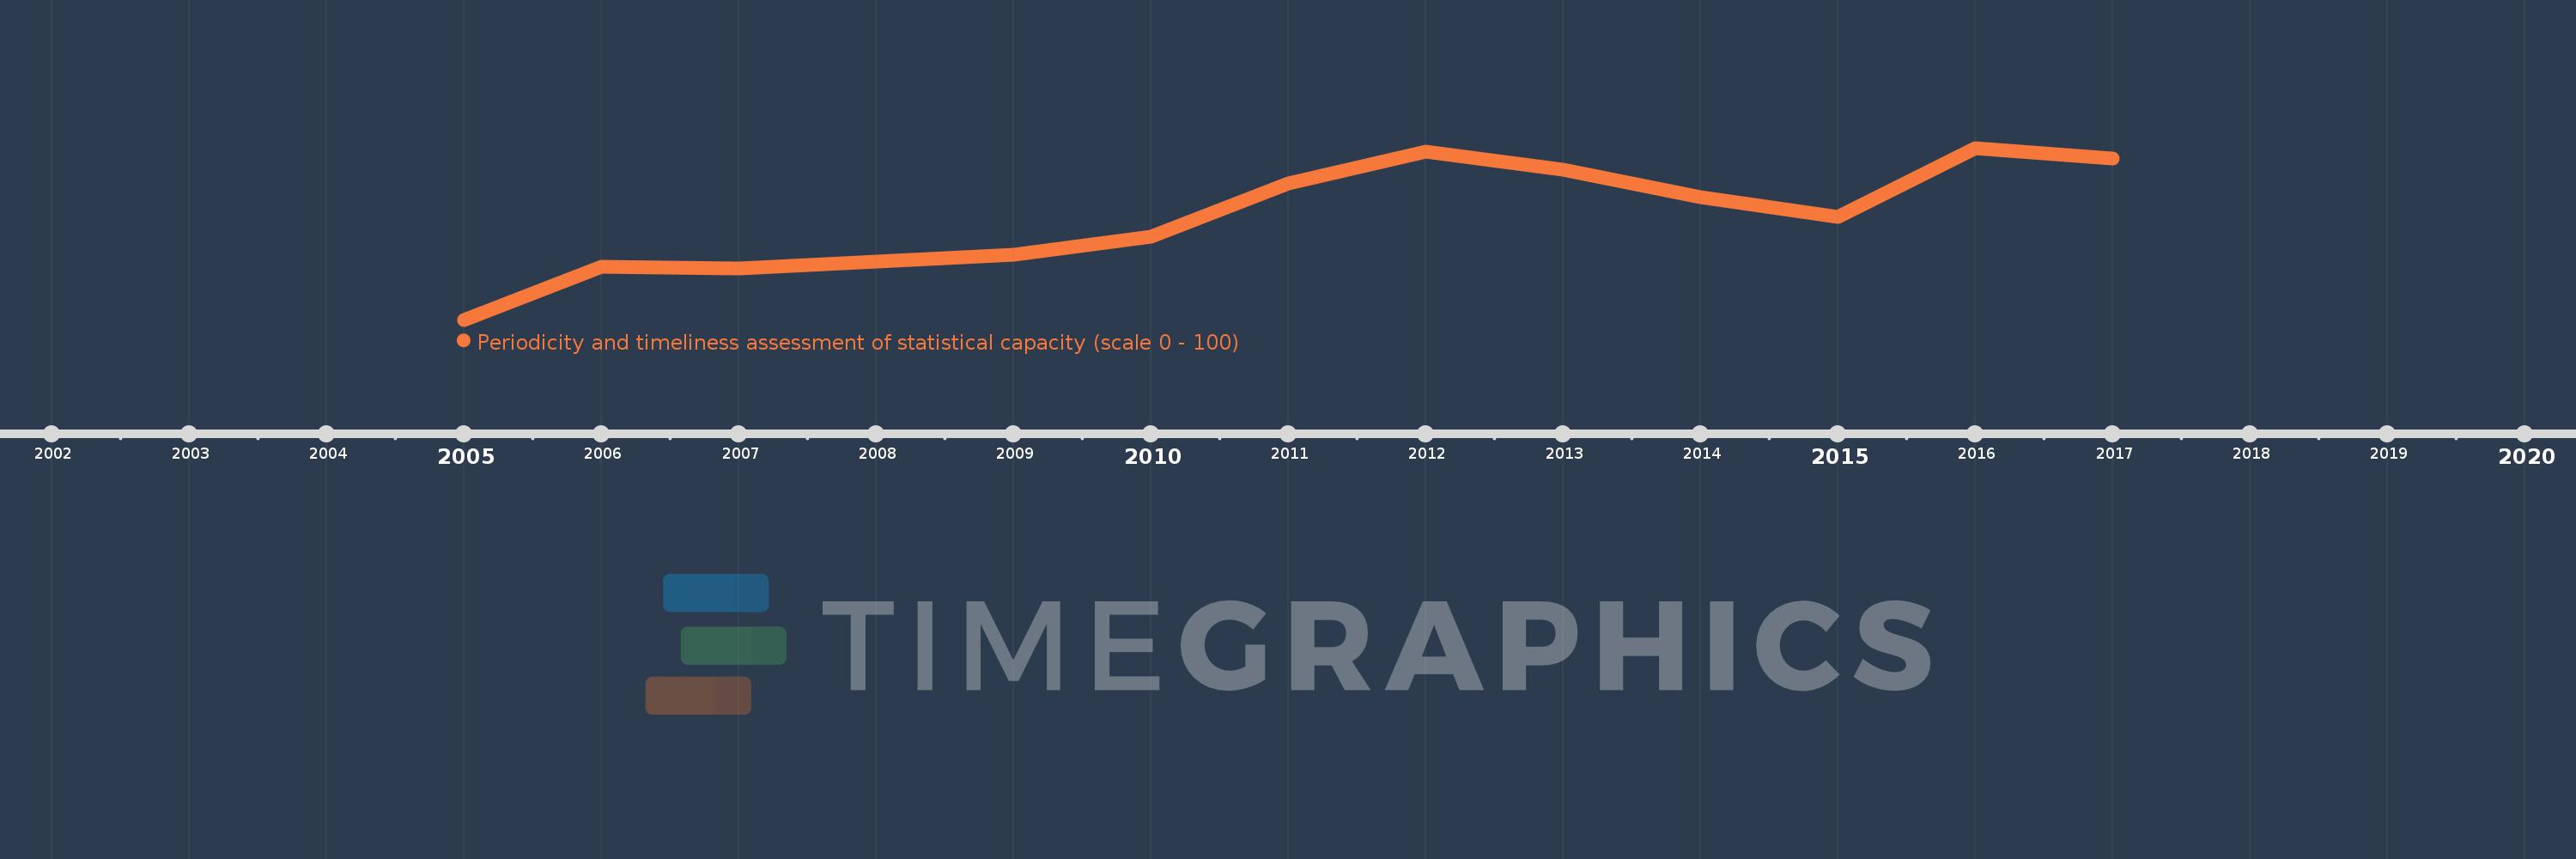
Periodicity and timeliness assessment of statistical capacity (scale 0 - 100)
2017,2016,2015,2014,2013,2012,2011,2010,2009,2008,2007,2006,2005
This statistics in other country:
Timeline:
This timeline shows a graph from 2005 to 2017 of Pre-demographic dividend. No data until 2004. Number of actual observations by date: 13.
Source name:
World Development Indicators
Source organization:
World Bank
Categories, topics:
Public Sector
Last updated:
apr 23, 2017
Indicators value changes by year
Minimum:
73.838
jan 1, 2005
Maximum:
81.333
jan 1, 2016
At the date of observation
Value
Absolute change
Change from previous value
jan 1, 2005
73.838
+73.838
0.0%
jan 1, 2006
76.162
+2.323
3.15%
jan 1, 2007
76.061
-0.101
-0.13%
jan 1, 2008
76.373
+0.312
0.41%
jan 1, 2009
76.667
+0.294
0.39%
jan 1, 2010
77.451
+0.784
1.02%
jan 1, 2011
79.804
+2.353
3.04%
jan 1, 2012
81.176
+1.373
1.72%
jan 1, 2013
80.392
-0.784
-0.97%
jan 1, 2014
79.19
-1.202
-1.49%
jan 1, 2015
78.333
-0.857
-1.08%
jan 1, 2016
81.333
+3.0
3.83%
jan 1, 2017
80.857
-0.476
-0.59%
Ranking of countries by current statistics by years


Comments: