29
/
en
AIzaSyAYiBZKx7MnpbEhh9jyipgxe19OcubqV5w
April 1, 2024
51279
Middle income
MIC
false
2
1
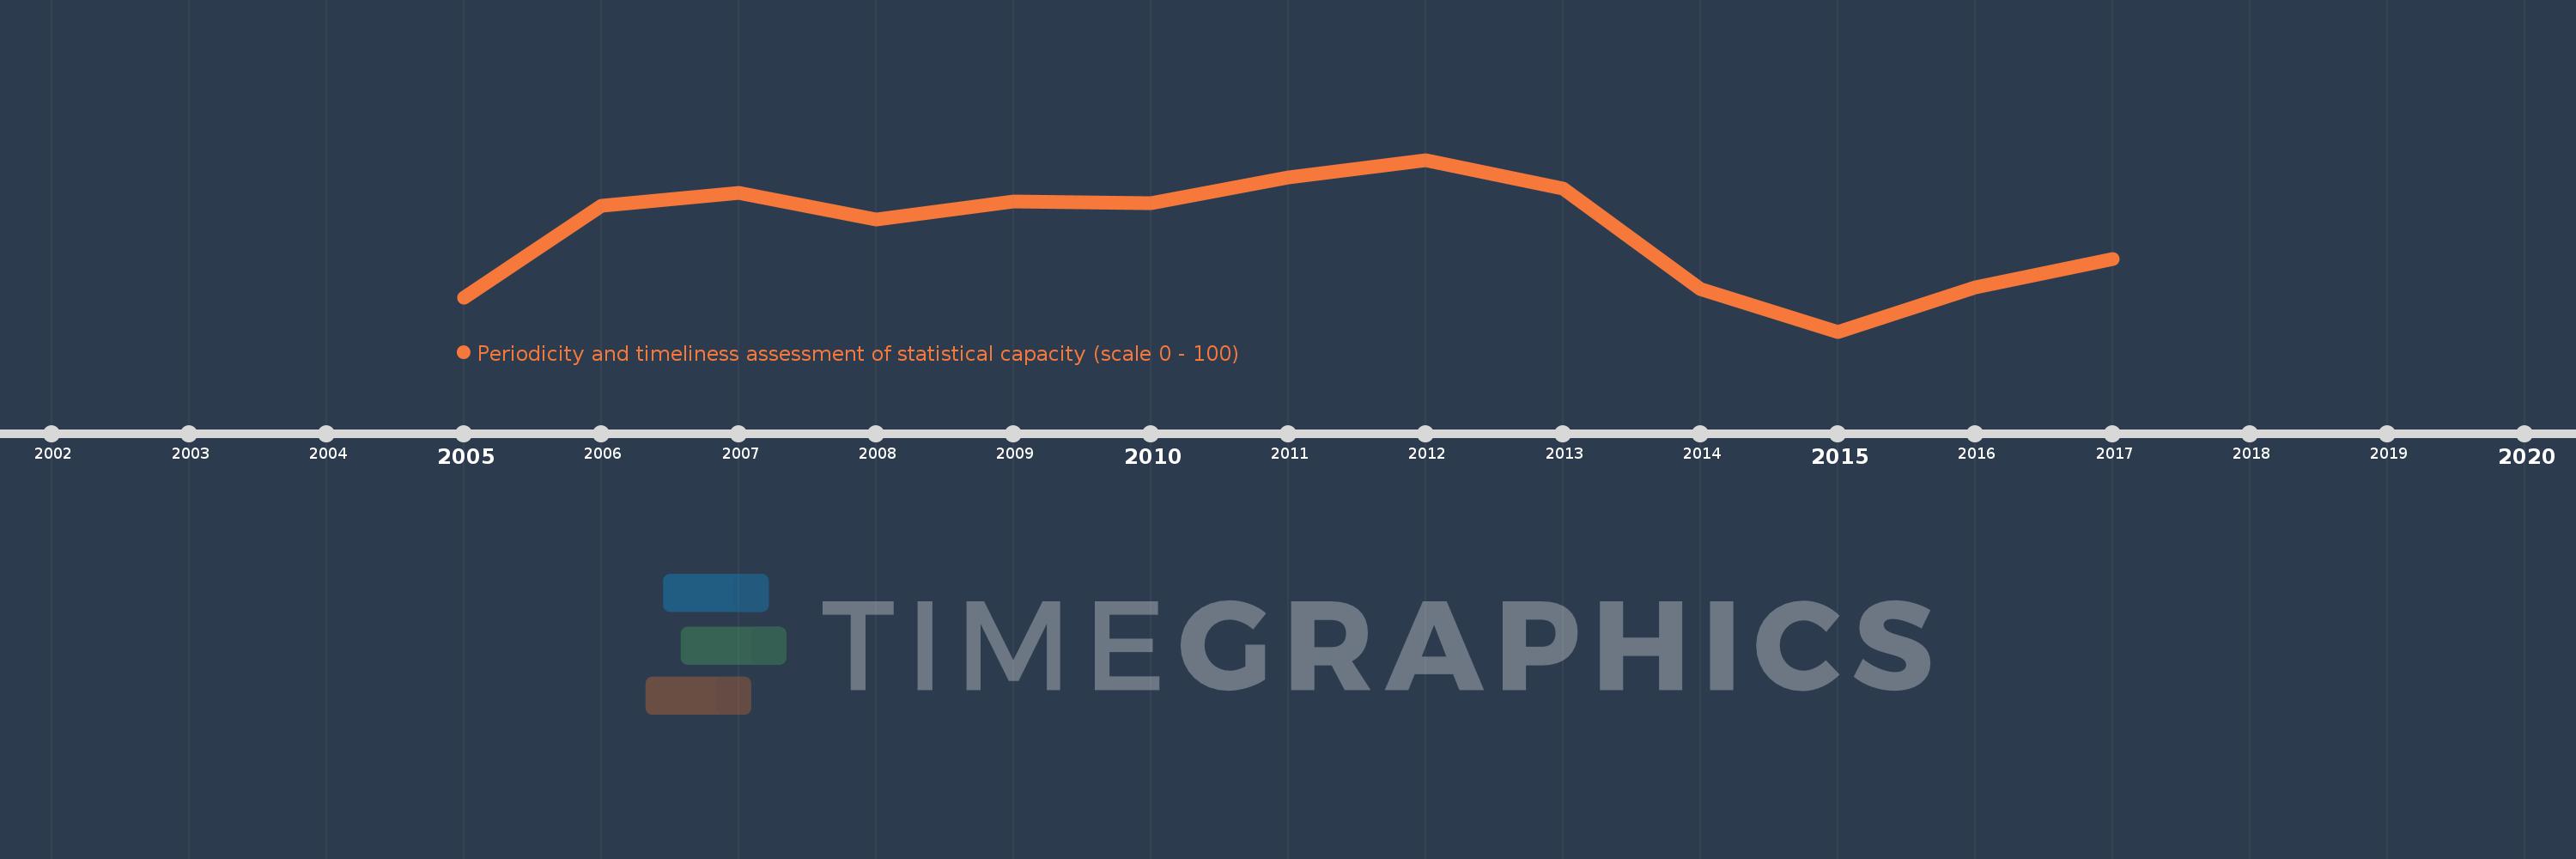
Periodicity and timeliness assessment of statistical capacity (scale 0 - 100)
2017,2016,2015,2014,2013,2012,2011,2010,2009,2008,2007,2006,2005
This statistics in other country:
Timeline:
This timeline shows a graph from 2005 to 2017 of Middle income. No data until 2004. Number of actual observations by date: 13.
Source name:
World Development Indicators
Source organization:
World Bank
Categories, topics:
Public Sector
Last updated:
apr 23, 2017
Indicators value changes by year
Minimum:
80.207
jan 1, 2015
Maximum:
83.663
jan 1, 2012
At the date of observation
Value
Absolute change
Change from previous value
jan 1, 2005
80.886
+80.886
0.0%
jan 1, 2006
82.743
+1.856
2.3%
jan 1, 2007
82.996
+0.253
0.31%
jan 1, 2008
82.458
-0.537
-0.65%
jan 1, 2009
82.833
+0.375
0.45%
jan 1, 2010
82.798
-0.035
-0.04%
jan 1, 2011
83.313
+0.514
0.62%
jan 1, 2012
83.663
+0.35
0.42%
jan 1, 2013
83.086
-0.576
-0.69%
jan 1, 2014
81.057
-2.03
-2.44%
jan 1, 2015
80.207
-0.85
-1.05%
jan 1, 2016
81.098
+0.89
1.11%
jan 1, 2017
81.667
+0.569
0.7%
Ranking of countries by current statistics by years


Comments: