29
/
en
AIzaSyAYiBZKx7MnpbEhh9jyipgxe19OcubqV5w
April 1, 2024
37683
IDA & IBRD total
IBT
false
2
1
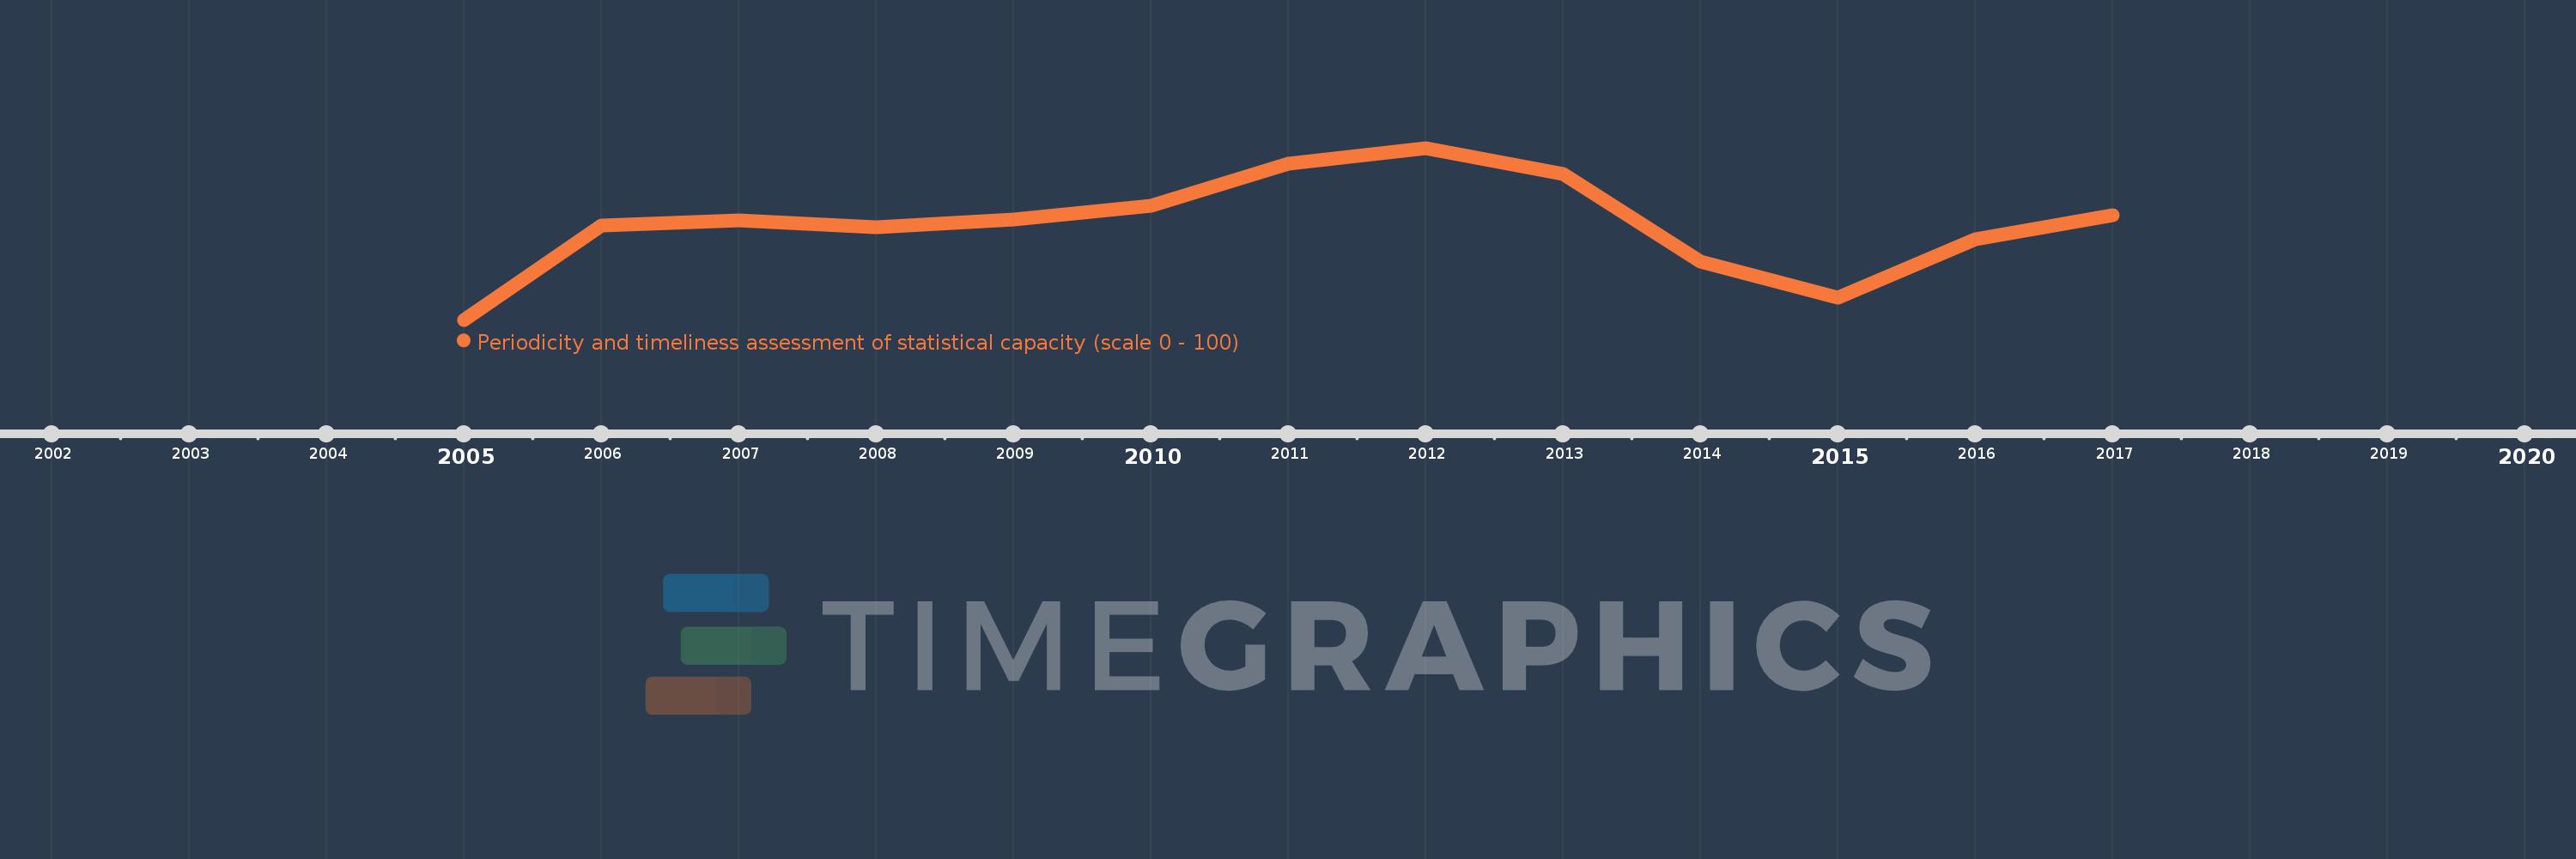
Periodicity and timeliness assessment of statistical capacity (scale 0 - 100)
2017,2016,2015,2014,2013,2012,2011,2010,2009,2008,2007,2006,2005
This statistics in other country:
Timeline:
This timeline shows a graph from 2005 to 2017 of IDA & IBRD total. No data until 2004. Number of actual observations by date: 13.
Source name:
World Development Indicators
Source organization:
World Bank
Categories, topics:
Public Sector
Last updated:
apr 23, 2017
Indicators value changes by year
Minimum:
79.405
jan 1, 2005
Maximum:
83.097
jan 1, 2012
At the date of observation
Value
Absolute change
Change from previous value
jan 1, 2005
79.405
+79.405
0.0%
jan 1, 2006
81.429
+2.024
2.55%
jan 1, 2007
81.548
+0.119
0.15%
jan 1, 2008
81.386
-0.161
-0.2%
jan 1, 2009
81.563
+0.177
0.22%
jan 1, 2010
81.858
+0.295
0.36%
jan 1, 2011
82.758
+0.9
1.1%
jan 1, 2012
83.097
+0.339
0.41%
jan 1, 2013
82.537
-0.56
-0.67%
jan 1, 2014
80.652
-1.885
-2.28%
jan 1, 2015
79.872
-0.78
-0.97%
jan 1, 2016
81.13
+1.258
1.58%
jan 1, 2017
81.652
+0.522
0.64%
Ranking of countries by current statistics by years


Comments: