29
/
en
AIzaSyAYiBZKx7MnpbEhh9jyipgxe19OcubqV5w
April 1, 2024
48448
Middle East & North Africa
MEA
false
2
1
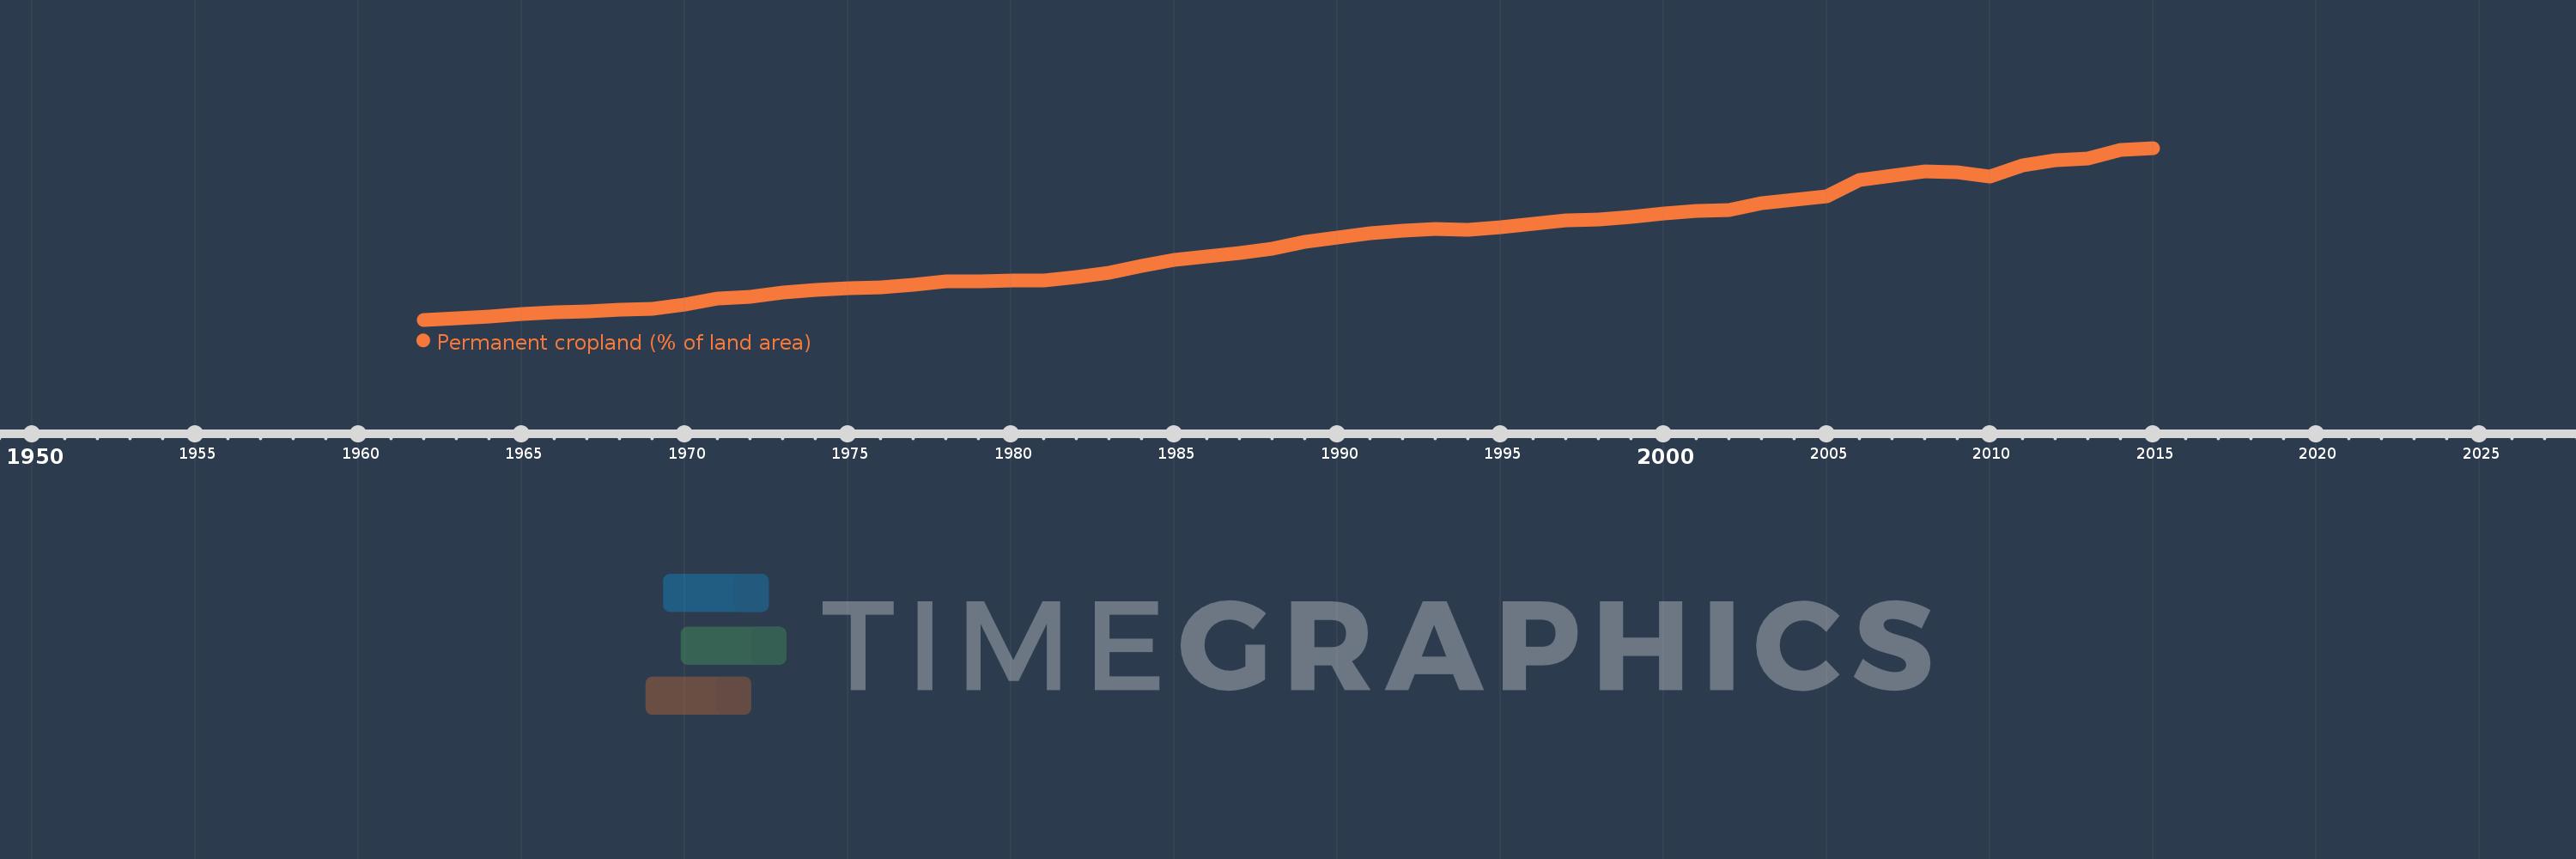
Permanent cropland (% of land area)
2015,2014,2013,2012,2011,2010,2009,2008,2007,2006,2005,2004,2003,2002,2001,2000,1999,1998,1997,1996,1995,1994,1993,1992,1991,1990,1989,1988,1987,1986,1985,1984,1983,1982,1981,1980,1979,1978,1977,1976,1975,1974,1973,1972,1971,1970,1969,1968,1967,1966,1965,1964,1963,1962
This statistics in other country:
AfghanistanAlbaniaAlgeriaAmerican SamoaAngolaAntigua and BarbudaArab WorldArgentinaArmeniaAustraliaAustriaAzerbaijanBahamas, TheBahrainBangladeshBarbadosBelarusBelgiumBelizeBeninBhutanBoliviaBosnia and HerzegovinaBotswanaBrazilBritish Virgin IslandsBrunei DarussalamBulgariaBurkina FasoBurundiCabo VerdeCambodiaCameroonCanadaCaribbean small statesCayman IslandsCentral African RepublicCentral Europe and the BalticsChadChileChinaColombiaComorosCongo, Dem. Rep.Congo, Rep.Costa RicaCote d'IvoireCroatiaCubaCyprusCzech RepublicDenmarkDominicaDominican RepublicEarly-demographic dividendEast Asia & PacificEast Asia & Pacific (excluding high income)East Asia & Pacific (IDA & IBRD countries)EcuadorEgypt, Arab Rep.El SalvadorEquatorial GuineaEritreaEstoniaEthiopiaEuro areaEurope & Central AsiaEurope & Central Asia (excluding high income)Europe & Central Asia (IDA & IBRD countries)European UnionFijiFinlandFragile and conflict affected situationsFranceFrench PolynesiaGabonGambia, TheGeorgiaGermanyGhanaGreeceGrenadaGuamGuatemalaGuineaGuinea-BissauGuyanaHaitiHeavily indebted poor countries (HIPC)High incomeHondurasHong Kong SAR, ChinaHungaryIBRD onlyIDA & IBRD totalIDA blendIDA onlyIDA totalIndiaIndonesiaIran, Islamic Rep.IraqIrelandIsraelItalyJamaicaJapanJordanKazakhstanKenyaKiribatiKorea, Dem. People’s Rep.Korea, Rep.KuwaitKyrgyz RepublicLao PDRLate-demographic dividendLatin America & Caribbean Latin America & Caribbean (excluding high income)Latin America & the Caribbean (IDA & IBRD countries)LatviaLeast developed countries: UN classificationLebanonLesothoLiberiaLibyaLithuaniaLow & middle incomeLow incomeLower middle incomeLuxembourgMacedonia, FYRMadagascarMalawiMalaysiaMaldivesMaliMaltaMarshall IslandsMauritaniaMauritiusMexicoMicronesia, Fed. Sts.Middle East & North AfricaMiddle East & North Africa (excluding high income)Middle East & North Africa (IDA & IBRD countries)Middle incomeMoldovaMongoliaMontenegroMoroccoMozambiqueMyanmarNamibiaNauruNepalNetherlandsNew CaledoniaNew ZealandNicaraguaNigerNigeriaNorth AmericaNorthern Mariana IslandsNorwayOECD membersOmanOther small statesPacific island small statesPakistanPalauPanamaPapua New GuineaParaguayPeruPhilippinesPolandPortugalPost-demographic dividendPre-demographic dividendPuerto RicoQatarRomaniaRussian FederationRwandaSamoaSao Tome and PrincipeSaudi ArabiaSenegalSerbiaSeychellesSierra LeoneSingaporeSlovak RepublicSloveniaSmall statesSolomon IslandsSomaliaSouth AfricaSouth AsiaSouth Asia (IDA & IBRD)SpainSri LankaSt. Kitts and NevisSt. LuciaSt. Vincent and the GrenadinesSub-Saharan Africa Sub-Saharan Africa (excluding high income)Sub-Saharan Africa (IDA & IBRD countries)SudanSurinameSwazilandSwedenSwitzerlandSyrian Arab RepublicTajikistanTanzaniaThailandTimor-LesteTogoTongaTrinidad and TobagoTunisiaTurkeyTurkmenistanTuvaluUgandaUkraineUnited Arab EmiratesUnited KingdomUnited StatesUpper middle incomeUruguayUzbekistanVanuatuVenezuela, RBVietnamVirgin Islands (U.S.)West Bank and GazaWorldYemen, Rep.ZambiaZimbabwe Timeline:
This timeline shows a graph from 1962 to 2015 of Middle East & North Africa. No data until 1961. Number of actual observations by date: 54.
Source name:
World Development Indicators
Source organization:
Food and Agriculture Organization, electronic files and web site.
Categories, topics:
Agriculture & Rural Development
Last updated:
apr 23, 2017
Indicators value changes by year
At the date of observation
Value
Absolute change
Change from previous value
jan 1, 1962
0.314
+0.314
0.0%
jan 1, 1963
0.318
+0.004
1.25%
jan 1, 1964
0.326
+0.008
2.56%
jan 1, 1965
0.335
+0.009
2.91%
jan 1, 1966
0.34
+0.004
1.25%
jan 1, 1967
0.342
+0.002
0.63%
jan 1, 1968
0.348
+0.006
1.86%
jan 1, 1969
0.351
+0.003
0.74%
jan 1, 1970
0.368
+0.017
4.84%
jan 1, 1971
0.386
+0.018
4.94%
jan 1, 1972
0.394
+0.008
2.16%
jan 1, 1973
0.407
+0.013
3.38%
jan 1, 1974
0.418
+0.011
2.59%
jan 1, 1975
0.423
+0.005
1.2%
jan 1, 1976
0.425
+0.002
0.38%
jan 1, 1977
0.435
+0.011
2.53%
jan 1, 1978
0.446
+0.01
2.4%
jan 1, 1979
0.446
+0.0
0.08%
jan 1, 1980
0.45
+0.004
0.92%
jan 1, 1981
0.451
+0.0
0.08%
jan 1, 1982
0.461
+0.01
2.24%
jan 1, 1983
0.475
+0.015
3.18%
jan 1, 1984
0.5
+0.025
5.24%
jan 1, 1985
0.521
+0.021
4.14%
jan 1, 1986
0.533
+0.012
2.26%
jan 1, 1987
0.544
+0.012
2.21%
jan 1, 1988
0.559
+0.015
2.69%
jan 1, 1989
0.584
+0.025
4.45%
jan 1, 1990
0.598
+0.014
2.41%
jan 1, 1991
0.614
+0.016
2.65%
jan 1, 1992
0.621
+0.007
1.13%
jan 1, 1993
0.629
+0.008
1.32%
jan 1, 1994
0.624
-0.005
-0.79%
jan 1, 1995
0.634
+0.009
1.51%
jan 1, 1996
0.645
+0.011
1.73%
jan 1, 1997
0.659
+0.014
2.21%
jan 1, 1998
0.661
+0.002
0.37%
jan 1, 1999
0.669
+0.007
1.13%
jan 1, 2000
0.68
+0.012
1.73%
jan 1, 2001
0.689
+0.009
1.26%
jan 1, 2002
0.693
+0.004
0.58%
jan 1, 2003
0.717
+0.024
3.48%
jan 1, 2004
0.728
+0.011
1.52%
jan 1, 2005
0.741
+0.013
1.84%
jan 1, 2006
0.796
+0.055
7.43%
jan 1, 2007
0.811
+0.014
1.81%
jan 1, 2008
0.828
+0.017
2.12%
jan 1, 2009
0.823
-0.005
-0.59%
jan 1, 2010
0.809
-0.014
-1.74%
jan 1, 2011
0.848
+0.04
4.9%
jan 1, 2012
0.867
+0.018
2.17%
jan 1, 2013
0.872
+0.005
0.62%
jan 1, 2014
0.9
+0.028
3.17%
jan 1, 2015
0.908
+0.008
0.91%
Ranking of countries by current statistics by years


Comments: