29
/
en
AIzaSyAYiBZKx7MnpbEhh9jyipgxe19OcubqV5w
April 1, 2024
125284
Egypt, Arab Rep.
EGY
true
2
1
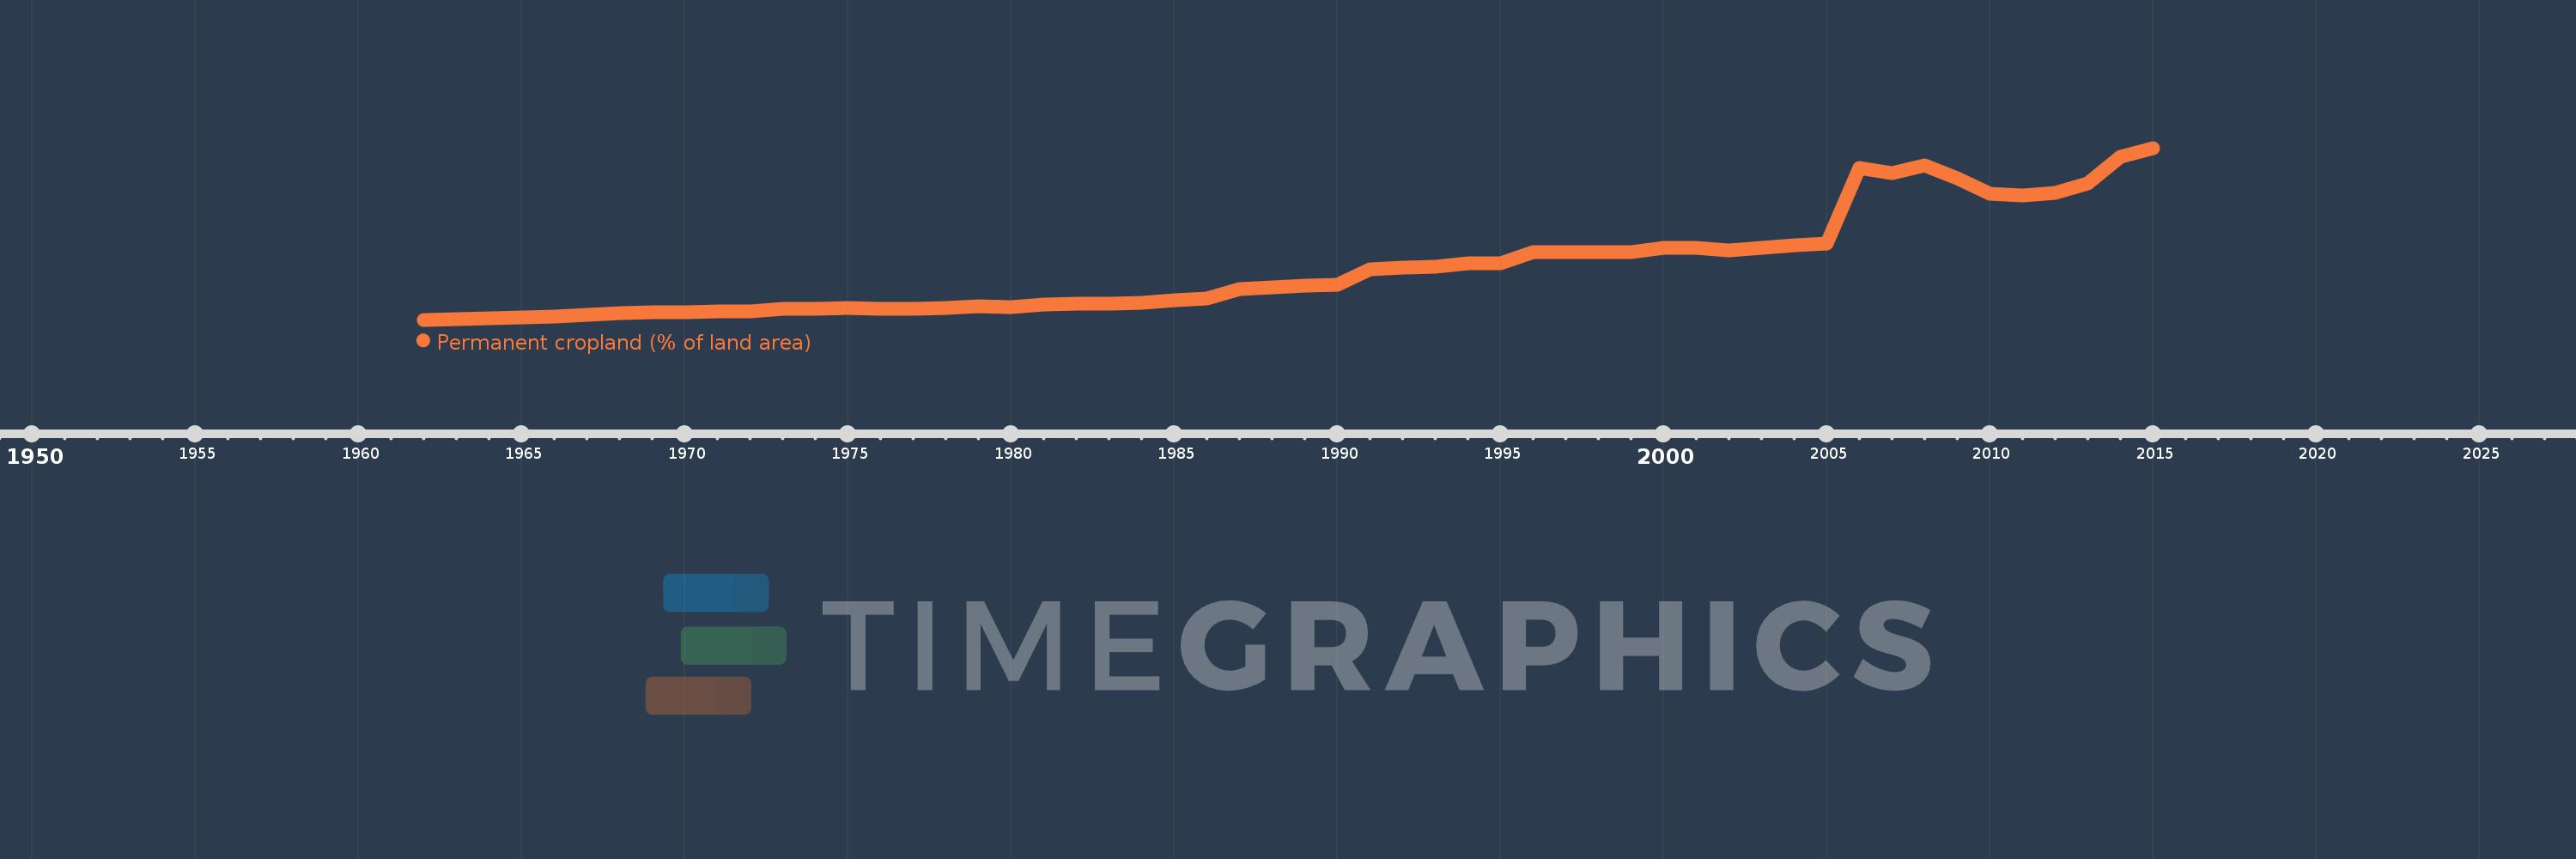
Permanent cropland (% of land area)
2015,2014,2013,2012,2011,2010,2009,2008,2007,2006,2005,2004,2003,2002,2001,2000,1999,1998,1997,1996,1995,1994,1993,1992,1991,1990,1989,1988,1987,1986,1985,1984,1983,1982,1981,1980,1979,1978,1977,1976,1975,1974,1973,1972,1971,1970,1969,1968,1967,1966,1965,1964,1963,1962
This statistics in other country:
AfghanistanAlbaniaAlgeriaAmerican SamoaAngolaAntigua and BarbudaArab WorldArgentinaArmeniaAustraliaAustriaAzerbaijanBahamas, TheBahrainBangladeshBarbadosBelarusBelgiumBelizeBeninBhutanBoliviaBosnia and HerzegovinaBotswanaBrazilBritish Virgin IslandsBrunei DarussalamBulgariaBurkina FasoBurundiCabo VerdeCambodiaCameroonCanadaCaribbean small statesCayman IslandsCentral African RepublicCentral Europe and the BalticsChadChileChinaColombiaComorosCongo, Dem. Rep.Congo, Rep.Costa RicaCote d'IvoireCroatiaCubaCyprusCzech RepublicDenmarkDominicaDominican RepublicEarly-demographic dividendEast Asia & PacificEast Asia & Pacific (excluding high income)East Asia & Pacific (IDA & IBRD countries)EcuadorEgypt, Arab Rep.El SalvadorEquatorial GuineaEritreaEstoniaEthiopiaEuro areaEurope & Central AsiaEurope & Central Asia (excluding high income)Europe & Central Asia (IDA & IBRD countries)European UnionFijiFinlandFragile and conflict affected situationsFranceFrench PolynesiaGabonGambia, TheGeorgiaGermanyGhanaGreeceGrenadaGuamGuatemalaGuineaGuinea-BissauGuyanaHaitiHeavily indebted poor countries (HIPC)High incomeHondurasHong Kong SAR, ChinaHungaryIBRD onlyIDA & IBRD totalIDA blendIDA onlyIDA totalIndiaIndonesiaIran, Islamic Rep.IraqIrelandIsraelItalyJamaicaJapanJordanKazakhstanKenyaKiribatiKorea, Dem. People’s Rep.Korea, Rep.KuwaitKyrgyz RepublicLao PDRLate-demographic dividendLatin America & Caribbean Latin America & Caribbean (excluding high income)Latin America & the Caribbean (IDA & IBRD countries)LatviaLeast developed countries: UN classificationLebanonLesothoLiberiaLibyaLithuaniaLow & middle incomeLow incomeLower middle incomeLuxembourgMacedonia, FYRMadagascarMalawiMalaysiaMaldivesMaliMaltaMarshall IslandsMauritaniaMauritiusMexicoMicronesia, Fed. Sts.Middle East & North AfricaMiddle East & North Africa (excluding high income)Middle East & North Africa (IDA & IBRD countries)Middle incomeMoldovaMongoliaMontenegroMoroccoMozambiqueMyanmarNamibiaNauruNepalNetherlandsNew CaledoniaNew ZealandNicaraguaNigerNigeriaNorth AmericaNorthern Mariana IslandsNorwayOECD membersOmanOther small statesPacific island small statesPakistanPalauPanamaPapua New GuineaParaguayPeruPhilippinesPolandPortugalPost-demographic dividendPre-demographic dividendPuerto RicoQatarRomaniaRussian FederationRwandaSamoaSao Tome and PrincipeSaudi ArabiaSenegalSerbiaSeychellesSierra LeoneSingaporeSlovak RepublicSloveniaSmall statesSolomon IslandsSomaliaSouth AfricaSouth AsiaSouth Asia (IDA & IBRD)SpainSri LankaSt. Kitts and NevisSt. LuciaSt. Vincent and the GrenadinesSub-Saharan Africa Sub-Saharan Africa (excluding high income)Sub-Saharan Africa (IDA & IBRD countries)SudanSurinameSwazilandSwedenSwitzerlandSyrian Arab RepublicTajikistanTanzaniaThailandTimor-LesteTogoTongaTrinidad and TobagoTunisiaTurkeyTurkmenistanTuvaluUgandaUkraineUnited Arab EmiratesUnited KingdomUnited StatesUpper middle incomeUruguayUzbekistanVanuatuVenezuela, RBVietnamVirgin Islands (U.S.)West Bank and GazaWorldYemen, Rep.ZambiaZimbabwe Timeline:
This timeline shows a graph from 1962 to 2015 of Egypt, Arab Rep.. No data until 1961. Number of actual observations by date: 54.
Source name:
World Development Indicators
Source organization:
Food and Agriculture Organization, electronic files and web site.
Categories, topics:
Agriculture & Rural Development
Last updated:
apr 23, 2017
Indicators value changes by year
At the date of observation
Value
Absolute change
Change from previous value
jan 1, 1962
0.069
+0.069
0.0%
jan 1, 1963
0.072
+0.003
4.35%
jan 1, 1964
0.077
+0.005
6.94%
jan 1, 1965
0.084
+0.007
9.09%
jan 1, 1966
0.09
+0.006
7.14%
jan 1, 1967
0.097
+0.007
7.78%
jan 1, 1968
0.107
+0.01
10.31%
jan 1, 1969
0.115
+0.007
6.54%
jan 1, 1970
0.111
-0.004
-3.51%
jan 1, 1971
0.119
+0.008
7.27%
jan 1, 1972
0.118
-0.001
-0.85%
jan 1, 1973
0.131
+0.013
11.11%
jan 1, 1974
0.133
+0.002
1.54%
jan 1, 1975
0.137
+0.004
3.03%
jan 1, 1976
0.135
-0.002
-1.47%
jan 1, 1977
0.135
0.0
0.0%
jan 1, 1978
0.137
+0.002
1.49%
jan 1, 1979
0.146
+0.009
6.62%
jan 1, 1980
0.144
-0.002
-1.38%
jan 1, 1981
0.16
+0.016
11.19%
jan 1, 1982
0.162
+0.002
1.26%
jan 1, 1983
0.165
+0.003
1.86%
jan 1, 1984
0.171
+0.006
3.66%
jan 1, 1985
0.184
+0.013
7.65%
jan 1, 1986
0.193
+0.009
4.92%
jan 1, 1987
0.25
+0.057
29.69%
jan 1, 1988
0.26
+0.01
4.02%
jan 1, 1989
0.272
+0.012
4.63%
jan 1, 1990
0.276
+0.004
1.48%
jan 1, 1991
0.366
+0.089
32.36%
jan 1, 1992
0.378
+0.012
3.3%
jan 1, 1993
0.383
+0.005
1.33%
jan 1, 1994
0.401
+0.018
4.72%
jan 1, 1995
0.402
+0.001
0.25%
jan 1, 1996
0.468
+0.066
16.5%
jan 1, 1997
0.468
0.0
0.0%
jan 1, 1998
0.468
0.0
0.0%
jan 1, 1999
0.468
0.0
0.0%
jan 1, 2000
0.491
+0.023
4.94%
jan 1, 2001
0.492
+0.001
0.2%
jan 1, 2002
0.479
-0.013
-2.65%
jan 1, 2003
0.49
+0.011
2.31%
jan 1, 2004
0.505
+0.015
3.07%
jan 1, 2005
0.515
+0.01
1.99%
jan 1, 2006
0.964
+0.449
87.13%
jan 1, 2007
0.932
-0.032
-3.33%
jan 1, 2008
0.978
+0.046
4.96%
jan 1, 2009
0.904
-0.074
-7.6%
jan 1, 2010
0.809
-0.095
-10.56%
jan 1, 2011
0.802
-0.007
-0.87%
jan 1, 2012
0.816
+0.014
1.75%
jan 1, 2013
0.871
+0.055
6.77%
jan 1, 2014
1.028
+0.157
17.99%
jan 1, 2015
1.08
+0.052
5.08%
Ranking of countries by current statistics by years


Comments: