29
/
en
AIzaSyAYiBZKx7MnpbEhh9jyipgxe19OcubqV5w
April 1, 2024
30196
Euro area
EMU
false
2
1
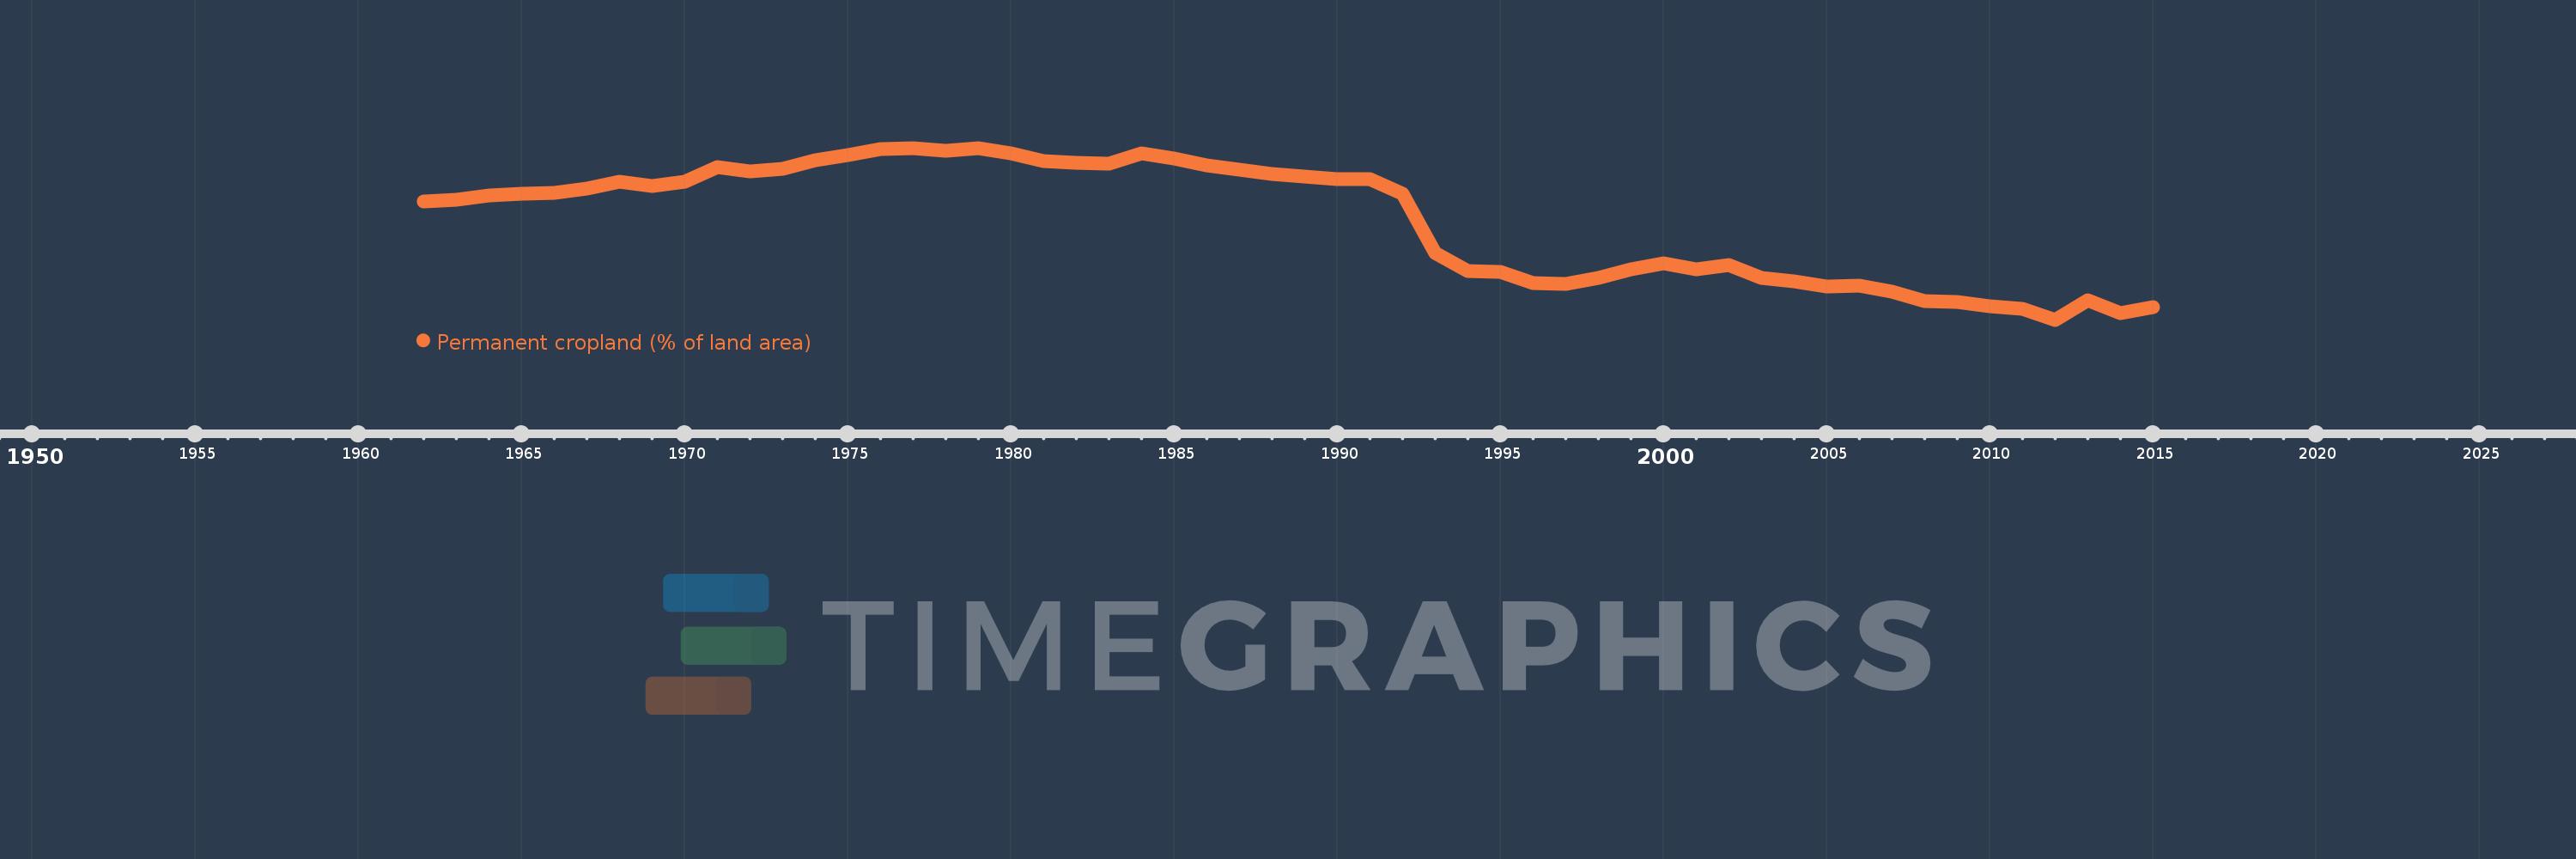
Permanent cropland (% of land area)
2015,2014,2013,2012,2011,2010,2009,2008,2007,2006,2005,2004,2003,2002,2001,2000,1999,1998,1997,1996,1995,1994,1993,1992,1991,1990,1989,1988,1987,1986,1985,1984,1983,1982,1981,1980,1979,1978,1977,1976,1975,1974,1973,1972,1971,1970,1969,1968,1967,1966,1965,1964,1963,1962
This statistics in other country:
AfghanistanAlbaniaAlgeriaAmerican SamoaAngolaAntigua and BarbudaArab WorldArgentinaArmeniaAustraliaAustriaAzerbaijanBahamas, TheBahrainBangladeshBarbadosBelarusBelgiumBelizeBeninBhutanBoliviaBosnia and HerzegovinaBotswanaBrazilBritish Virgin IslandsBrunei DarussalamBulgariaBurkina FasoBurundiCabo VerdeCambodiaCameroonCanadaCaribbean small statesCayman IslandsCentral African RepublicCentral Europe and the BalticsChadChileChinaColombiaComorosCongo, Dem. Rep.Congo, Rep.Costa RicaCote d'IvoireCroatiaCubaCyprusCzech RepublicDenmarkDominicaDominican RepublicEarly-demographic dividendEast Asia & PacificEast Asia & Pacific (excluding high income)East Asia & Pacific (IDA & IBRD countries)EcuadorEgypt, Arab Rep.El SalvadorEquatorial GuineaEritreaEstoniaEthiopiaEuro areaEurope & Central AsiaEurope & Central Asia (excluding high income)Europe & Central Asia (IDA & IBRD countries)European UnionFijiFinlandFragile and conflict affected situationsFranceFrench PolynesiaGabonGambia, TheGeorgiaGermanyGhanaGreeceGrenadaGuamGuatemalaGuineaGuinea-BissauGuyanaHaitiHeavily indebted poor countries (HIPC)High incomeHondurasHong Kong SAR, ChinaHungaryIBRD onlyIDA & IBRD totalIDA blendIDA onlyIDA totalIndiaIndonesiaIran, Islamic Rep.IraqIrelandIsraelItalyJamaicaJapanJordanKazakhstanKenyaKiribatiKorea, Dem. People’s Rep.Korea, Rep.KuwaitKyrgyz RepublicLao PDRLate-demographic dividendLatin America & Caribbean Latin America & Caribbean (excluding high income)Latin America & the Caribbean (IDA & IBRD countries)LatviaLeast developed countries: UN classificationLebanonLesothoLiberiaLibyaLithuaniaLow & middle incomeLow incomeLower middle incomeLuxembourgMacedonia, FYRMadagascarMalawiMalaysiaMaldivesMaliMaltaMarshall IslandsMauritaniaMauritiusMexicoMicronesia, Fed. Sts.Middle East & North AfricaMiddle East & North Africa (excluding high income)Middle East & North Africa (IDA & IBRD countries)Middle incomeMoldovaMongoliaMontenegroMoroccoMozambiqueMyanmarNamibiaNauruNepalNetherlandsNew CaledoniaNew ZealandNicaraguaNigerNigeriaNorth AmericaNorthern Mariana IslandsNorwayOECD membersOmanOther small statesPacific island small statesPakistanPalauPanamaPapua New GuineaParaguayPeruPhilippinesPolandPortugalPost-demographic dividendPre-demographic dividendPuerto RicoQatarRomaniaRussian FederationRwandaSamoaSao Tome and PrincipeSaudi ArabiaSenegalSerbiaSeychellesSierra LeoneSingaporeSlovak RepublicSloveniaSmall statesSolomon IslandsSomaliaSouth AfricaSouth AsiaSouth Asia (IDA & IBRD)SpainSri LankaSt. Kitts and NevisSt. LuciaSt. Vincent and the GrenadinesSub-Saharan Africa Sub-Saharan Africa (excluding high income)Sub-Saharan Africa (IDA & IBRD countries)SudanSurinameSwazilandSwedenSwitzerlandSyrian Arab RepublicTajikistanTanzaniaThailandTimor-LesteTogoTongaTrinidad and TobagoTunisiaTurkeyTurkmenistanTuvaluUgandaUkraineUnited Arab EmiratesUnited KingdomUnited StatesUpper middle incomeUruguayUzbekistanVanuatuVenezuela, RBVietnamVirgin Islands (U.S.)West Bank and GazaWorldYemen, Rep.ZambiaZimbabwe Timeline:
This timeline shows a graph from 1962 to 2015 of Euro area. No data until 1961. Number of actual observations by date: 54.
Source name:
World Development Indicators
Source organization:
Food and Agriculture Organization, electronic files and web site.
Categories, topics:
Agriculture & Rural Development
Last updated:
apr 23, 2017
Indicators value changes by year
At the date of observation
Value
Absolute change
Change from previous value
jan 1, 1962
4.623
+4.623
0.0%
jan 1, 1963
4.631
+0.007
0.16%
jan 1, 1964
4.659
+0.028
0.61%
jan 1, 1965
4.669
+0.01
0.21%
jan 1, 1966
4.674
+0.005
0.1%
jan 1, 1967
4.701
+0.027
0.59%
jan 1, 1968
4.741
+0.04
0.86%
jan 1, 1969
4.715
-0.026
-0.55%
jan 1, 1970
4.74
+0.025
0.54%
jan 1, 1971
4.83
+0.089
1.88%
jan 1, 1972
4.805
-0.024
-0.5%
jan 1, 1973
4.82
+0.015
0.31%
jan 1, 1974
4.872
+0.051
1.07%
jan 1, 1975
4.903
+0.032
0.65%
jan 1, 1976
4.943
+0.04
0.81%
jan 1, 1977
4.948
+0.005
0.1%
jan 1, 1978
4.932
-0.016
-0.33%
jan 1, 1979
4.944
+0.012
0.24%
jan 1, 1980
4.916
-0.028
-0.57%
jan 1, 1981
4.868
-0.048
-0.98%
jan 1, 1982
4.859
-0.009
-0.18%
jan 1, 1983
4.853
-0.006
-0.13%
jan 1, 1984
4.914
+0.061
1.27%
jan 1, 1985
4.882
-0.032
-0.65%
jan 1, 1986
4.841
-0.041
-0.84%
jan 1, 1987
4.816
-0.025
-0.52%
jan 1, 1988
4.787
-0.029
-0.59%
jan 1, 1989
4.772
-0.015
-0.32%
jan 1, 1990
4.756
-0.016
-0.33%
jan 1, 1991
4.757
+0.0
0.01%
jan 1, 1992
4.668
-0.089
-1.87%
jan 1, 1993
4.307
-0.361
-7.73%
jan 1, 1994
4.198
-0.109
-2.53%
jan 1, 1995
4.19
-0.008
-0.19%
jan 1, 1996
4.124
-0.066
-1.58%
jan 1, 1997
4.117
-0.007
-0.16%
jan 1, 1998
4.153
+0.035
0.86%
jan 1, 1999
4.208
+0.056
1.34%
jan 1, 2000
4.242
+0.034
0.8%
jan 1, 2001
4.207
-0.036
-0.84%
jan 1, 2002
4.231
+0.024
0.57%
jan 1, 2003
4.152
-0.079
-1.86%
jan 1, 2004
4.134
-0.018
-0.44%
jan 1, 2005
4.102
-0.032
-0.77%
jan 1, 2006
4.106
+0.004
0.09%
jan 1, 2007
4.069
-0.037
-0.89%
jan 1, 2008
4.013
-0.056
-1.37%
jan 1, 2009
4.005
-0.008
-0.21%
jan 1, 2010
3.983
-0.022
-0.55%
jan 1, 2011
3.968
-0.015
-0.37%
jan 1, 2012
3.899
-0.069
-1.75%
jan 1, 2013
4.018
+0.119
3.05%
jan 1, 2014
3.941
-0.077
-1.91%
jan 1, 2015
3.977
+0.036
0.9%
Ranking of countries by current statistics by years


Comments: