29
/
en
AIzaSyAYiBZKx7MnpbEhh9jyipgxe19OcubqV5w
April 1, 2024
45459
Low & middle income
LMY
false
2
1
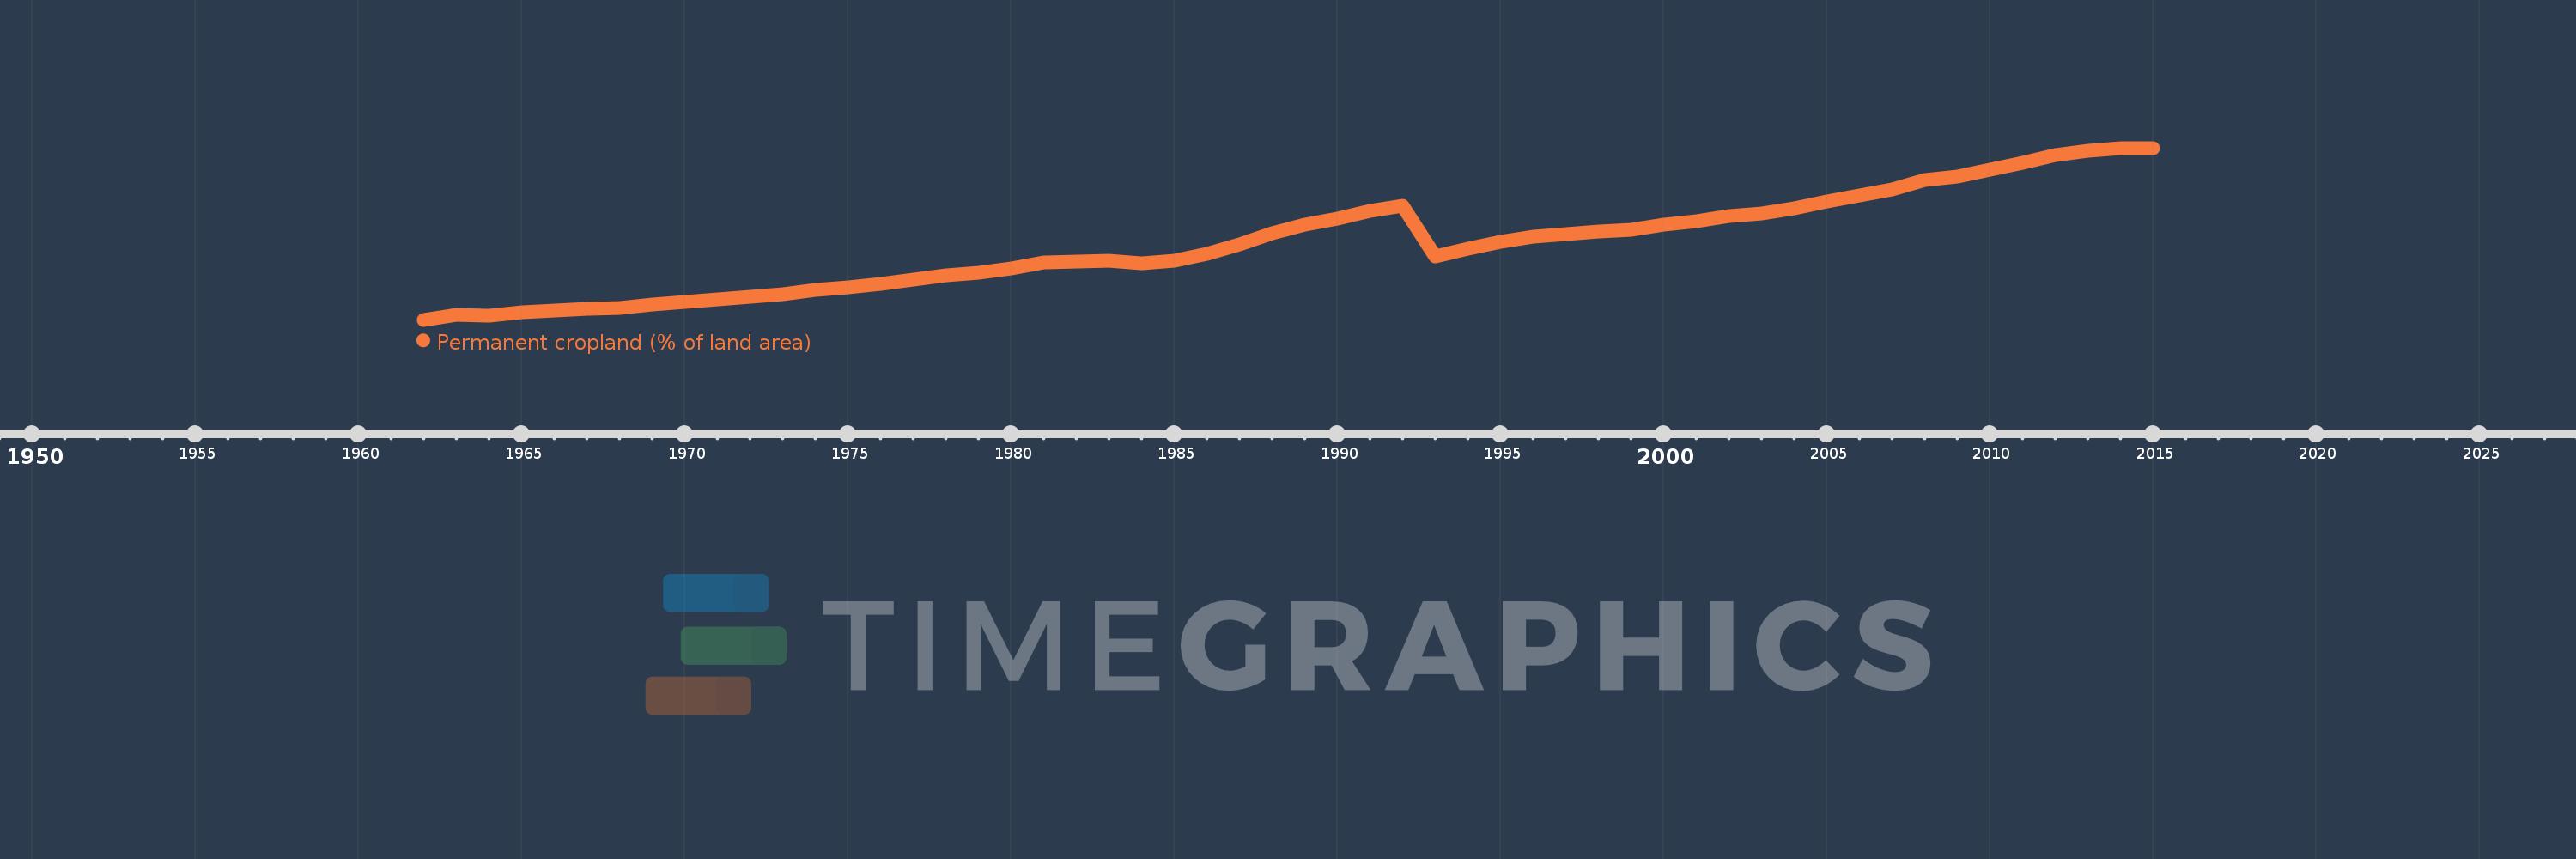
Permanent cropland (% of land area)
2015,2014,2013,2012,2011,2010,2009,2008,2007,2006,2005,2004,2003,2002,2001,2000,1999,1998,1997,1996,1995,1994,1993,1992,1991,1990,1989,1988,1987,1986,1985,1984,1983,1982,1981,1980,1979,1978,1977,1976,1975,1974,1973,1972,1971,1970,1969,1968,1967,1966,1965,1964,1963,1962
This statistics in other country:
AfghanistanAlbaniaAlgeriaAmerican SamoaAngolaAntigua and BarbudaArab WorldArgentinaArmeniaAustraliaAustriaAzerbaijanBahamas, TheBahrainBangladeshBarbadosBelarusBelgiumBelizeBeninBhutanBoliviaBosnia and HerzegovinaBotswanaBrazilBritish Virgin IslandsBrunei DarussalamBulgariaBurkina FasoBurundiCabo VerdeCambodiaCameroonCanadaCaribbean small statesCayman IslandsCentral African RepublicCentral Europe and the BalticsChadChileChinaColombiaComorosCongo, Dem. Rep.Congo, Rep.Costa RicaCote d'IvoireCroatiaCubaCyprusCzech RepublicDenmarkDominicaDominican RepublicEarly-demographic dividendEast Asia & PacificEast Asia & Pacific (excluding high income)East Asia & Pacific (IDA & IBRD countries)EcuadorEgypt, Arab Rep.El SalvadorEquatorial GuineaEritreaEstoniaEthiopiaEuro areaEurope & Central AsiaEurope & Central Asia (excluding high income)Europe & Central Asia (IDA & IBRD countries)European UnionFijiFinlandFragile and conflict affected situationsFranceFrench PolynesiaGabonGambia, TheGeorgiaGermanyGhanaGreeceGrenadaGuamGuatemalaGuineaGuinea-BissauGuyanaHaitiHeavily indebted poor countries (HIPC)High incomeHondurasHong Kong SAR, ChinaHungaryIBRD onlyIDA & IBRD totalIDA blendIDA onlyIDA totalIndiaIndonesiaIran, Islamic Rep.IraqIrelandIsraelItalyJamaicaJapanJordanKazakhstanKenyaKiribatiKorea, Dem. People’s Rep.Korea, Rep.KuwaitKyrgyz RepublicLao PDRLate-demographic dividendLatin America & Caribbean Latin America & Caribbean (excluding high income)Latin America & the Caribbean (IDA & IBRD countries)LatviaLeast developed countries: UN classificationLebanonLesothoLiberiaLibyaLithuaniaLow & middle incomeLow incomeLower middle incomeLuxembourgMacedonia, FYRMadagascarMalawiMalaysiaMaldivesMaliMaltaMarshall IslandsMauritaniaMauritiusMexicoMicronesia, Fed. Sts.Middle East & North AfricaMiddle East & North Africa (excluding high income)Middle East & North Africa (IDA & IBRD countries)Middle incomeMoldovaMongoliaMontenegroMoroccoMozambiqueMyanmarNamibiaNauruNepalNetherlandsNew CaledoniaNew ZealandNicaraguaNigerNigeriaNorth AmericaNorthern Mariana IslandsNorwayOECD membersOmanOther small statesPacific island small statesPakistanPalauPanamaPapua New GuineaParaguayPeruPhilippinesPolandPortugalPost-demographic dividendPre-demographic dividendPuerto RicoQatarRomaniaRussian FederationRwandaSamoaSao Tome and PrincipeSaudi ArabiaSenegalSerbiaSeychellesSierra LeoneSingaporeSlovak RepublicSloveniaSmall statesSolomon IslandsSomaliaSouth AfricaSouth AsiaSouth Asia (IDA & IBRD)SpainSri LankaSt. Kitts and NevisSt. LuciaSt. Vincent and the GrenadinesSub-Saharan Africa Sub-Saharan Africa (excluding high income)Sub-Saharan Africa (IDA & IBRD countries)SudanSurinameSwazilandSwedenSwitzerlandSyrian Arab RepublicTajikistanTanzaniaThailandTimor-LesteTogoTongaTrinidad and TobagoTunisiaTurkeyTurkmenistanTuvaluUgandaUkraineUnited Arab EmiratesUnited KingdomUnited StatesUpper middle incomeUruguayUzbekistanVanuatuVenezuela, RBVietnamVirgin Islands (U.S.)West Bank and GazaWorldYemen, Rep.ZambiaZimbabwe Timeline:
This timeline shows a graph from 1962 to 2015 of Low & middle income. No data until 1961. Number of actual observations by date: 54.
Source name:
World Development Indicators
Source organization:
Food and Agriculture Organization, electronic files and web site.
Categories, topics:
Agriculture & Rural Development
Last updated:
apr 23, 2017
Indicators value changes by year
At the date of observation
Value
Absolute change
Change from previous value
jan 1, 1962
0.783
+0.783
0.0%
jan 1, 1963
0.804
+0.02
2.61%
jan 1, 1964
0.802
-0.002
-0.2%
jan 1, 1965
0.816
+0.014
1.8%
jan 1, 1966
0.821
+0.004
0.51%
jan 1, 1967
0.828
+0.007
0.85%
jan 1, 1968
0.833
+0.005
0.61%
jan 1, 1969
0.848
+0.015
1.81%
jan 1, 1970
0.861
+0.013
1.53%
jan 1, 1971
0.869
+0.009
1.01%
jan 1, 1972
0.883
+0.014
1.61%
jan 1, 1973
0.894
+0.011
1.21%
jan 1, 1974
0.91
+0.015
1.72%
jan 1, 1975
0.922
+0.012
1.36%
jan 1, 1976
0.937
+0.015
1.6%
jan 1, 1977
0.955
+0.018
1.96%
jan 1, 1978
0.973
+0.018
1.87%
jan 1, 1979
0.986
+0.013
1.36%
jan 1, 1980
1.004
+0.018
1.8%
jan 1, 1981
1.027
+0.023
2.28%
jan 1, 1982
1.034
+0.007
0.7%
jan 1, 1983
1.037
+0.003
0.29%
jan 1, 1984
1.025
-0.012
-1.13%
jan 1, 1985
1.035
+0.01
0.93%
jan 1, 1986
1.066
+0.031
3.03%
jan 1, 1987
1.108
+0.042
3.97%
jan 1, 1988
1.153
+0.045
4.02%
jan 1, 1989
1.192
+0.039
3.35%
jan 1, 1990
1.216
+0.025
2.07%
jan 1, 1991
1.251
+0.035
2.89%
jan 1, 1992
1.273
+0.022
1.72%
jan 1, 1993
1.055
-0.218
-17.16%
jan 1, 1994
1.088
+0.034
3.2%
jan 1, 1995
1.118
+0.029
2.69%
jan 1, 1996
1.14
+0.023
2.03%
jan 1, 1997
1.151
+0.011
0.95%
jan 1, 1998
1.16
+0.009
0.76%
jan 1, 1999
1.17
+0.01
0.89%
jan 1, 2000
1.191
+0.021
1.79%
jan 1, 2001
1.207
+0.016
1.32%
jan 1, 2002
1.226
+0.019
1.6%
jan 1, 2003
1.238
+0.012
1.0%
jan 1, 2004
1.26
+0.021
1.73%
jan 1, 2005
1.29
+0.03
2.39%
jan 1, 2006
1.316
+0.026
1.99%
jan 1, 2007
1.342
+0.026
2.0%
jan 1, 2008
1.381
+0.039
2.9%
jan 1, 2009
1.399
+0.018
1.3%
jan 1, 2010
1.426
+0.028
1.98%
jan 1, 2011
1.457
+0.031
2.15%
jan 1, 2012
1.49
+0.033
2.29%
jan 1, 2013
1.507
+0.017
1.14%
jan 1, 2014
1.518
+0.011
0.73%
jan 1, 2015
1.52
+0.002
0.12%
Ranking of countries by current statistics by years


Comments: