29
/
en
AIzaSyAYiBZKx7MnpbEhh9jyipgxe19OcubqV5w
April 1, 2024
126670
El Salvador
SLV
true
2
1
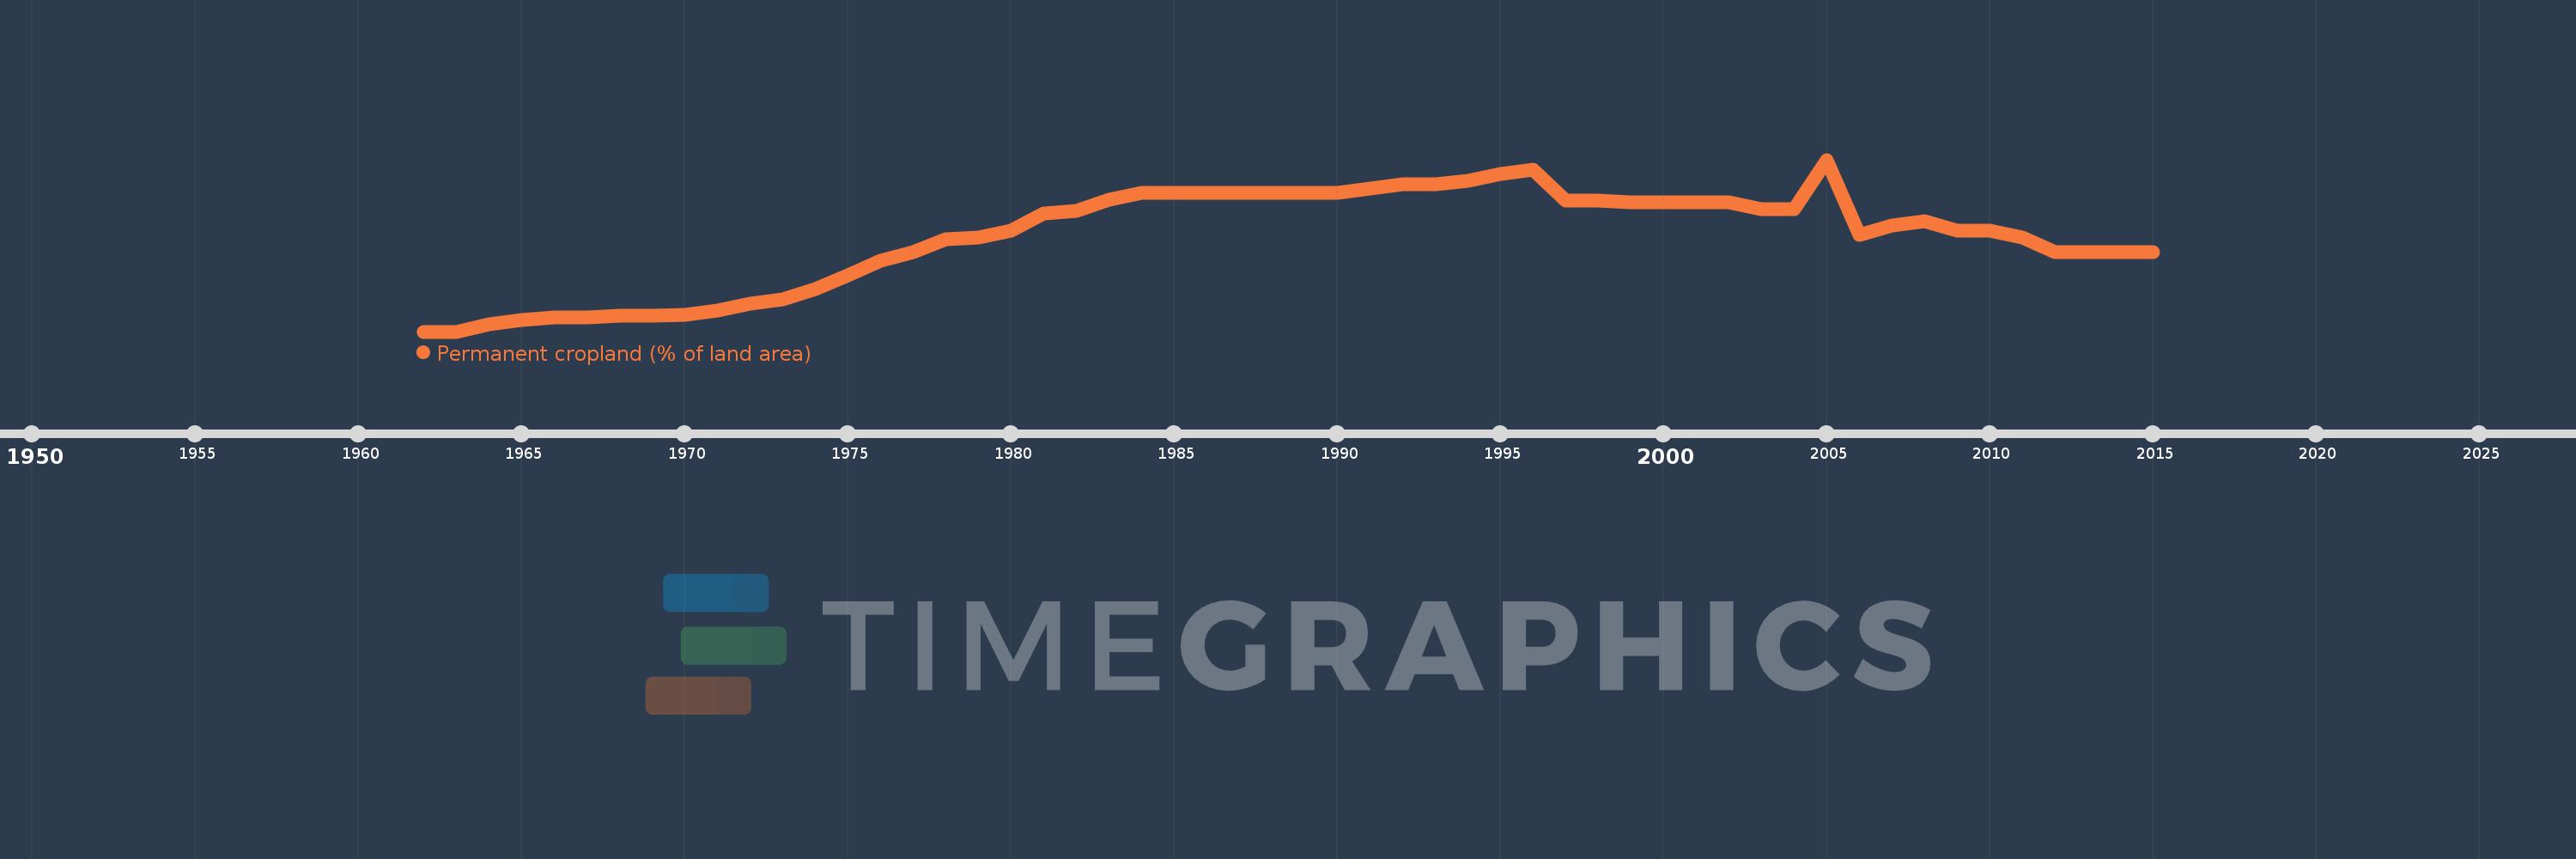
Permanent cropland (% of land area)
2015,2014,2013,2012,2011,2010,2009,2008,2007,2006,2005,2004,2003,2002,2001,2000,1999,1998,1997,1996,1995,1994,1993,1992,1991,1990,1989,1988,1987,1986,1985,1984,1983,1982,1981,1980,1979,1978,1977,1976,1975,1974,1973,1972,1971,1970,1969,1968,1967,1966,1965,1964,1963,1962
This statistics in other country:
AfghanistanAlbaniaAlgeriaAmerican SamoaAngolaAntigua and BarbudaArab WorldArgentinaArmeniaAustraliaAustriaAzerbaijanBahamas, TheBahrainBangladeshBarbadosBelarusBelgiumBelizeBeninBhutanBoliviaBosnia and HerzegovinaBotswanaBrazilBritish Virgin IslandsBrunei DarussalamBulgariaBurkina FasoBurundiCabo VerdeCambodiaCameroonCanadaCaribbean small statesCayman IslandsCentral African RepublicCentral Europe and the BalticsChadChileChinaColombiaComorosCongo, Dem. Rep.Congo, Rep.Costa RicaCote d'IvoireCroatiaCubaCyprusCzech RepublicDenmarkDominicaDominican RepublicEarly-demographic dividendEast Asia & PacificEast Asia & Pacific (excluding high income)East Asia & Pacific (IDA & IBRD countries)EcuadorEgypt, Arab Rep.El SalvadorEquatorial GuineaEritreaEstoniaEthiopiaEuro areaEurope & Central AsiaEurope & Central Asia (excluding high income)Europe & Central Asia (IDA & IBRD countries)European UnionFijiFinlandFragile and conflict affected situationsFranceFrench PolynesiaGabonGambia, TheGeorgiaGermanyGhanaGreeceGrenadaGuamGuatemalaGuineaGuinea-BissauGuyanaHaitiHeavily indebted poor countries (HIPC)High incomeHondurasHong Kong SAR, ChinaHungaryIBRD onlyIDA & IBRD totalIDA blendIDA onlyIDA totalIndiaIndonesiaIran, Islamic Rep.IraqIrelandIsraelItalyJamaicaJapanJordanKazakhstanKenyaKiribatiKorea, Dem. People’s Rep.Korea, Rep.KuwaitKyrgyz RepublicLao PDRLate-demographic dividendLatin America & Caribbean Latin America & Caribbean (excluding high income)Latin America & the Caribbean (IDA & IBRD countries)LatviaLeast developed countries: UN classificationLebanonLesothoLiberiaLibyaLithuaniaLow & middle incomeLow incomeLower middle incomeLuxembourgMacedonia, FYRMadagascarMalawiMalaysiaMaldivesMaliMaltaMarshall IslandsMauritaniaMauritiusMexicoMicronesia, Fed. Sts.Middle East & North AfricaMiddle East & North Africa (excluding high income)Middle East & North Africa (IDA & IBRD countries)Middle incomeMoldovaMongoliaMontenegroMoroccoMozambiqueMyanmarNamibiaNauruNepalNetherlandsNew CaledoniaNew ZealandNicaraguaNigerNigeriaNorth AmericaNorthern Mariana IslandsNorwayOECD membersOmanOther small statesPacific island small statesPakistanPalauPanamaPapua New GuineaParaguayPeruPhilippinesPolandPortugalPost-demographic dividendPre-demographic dividendPuerto RicoQatarRomaniaRussian FederationRwandaSamoaSao Tome and PrincipeSaudi ArabiaSenegalSerbiaSeychellesSierra LeoneSingaporeSlovak RepublicSloveniaSmall statesSolomon IslandsSomaliaSouth AfricaSouth AsiaSouth Asia (IDA & IBRD)SpainSri LankaSt. Kitts and NevisSt. LuciaSt. Vincent and the GrenadinesSub-Saharan Africa Sub-Saharan Africa (excluding high income)Sub-Saharan Africa (IDA & IBRD countries)SudanSurinameSwazilandSwedenSwitzerlandSyrian Arab RepublicTajikistanTanzaniaThailandTimor-LesteTogoTongaTrinidad and TobagoTunisiaTurkeyTurkmenistanTuvaluUgandaUkraineUnited Arab EmiratesUnited KingdomUnited StatesUpper middle incomeUruguayUzbekistanVanuatuVenezuela, RBVietnamVirgin Islands (U.S.)West Bank and GazaWorldYemen, Rep.ZambiaZimbabwe Timeline:
This timeline shows a graph from 1962 to 2015 of El Salvador. No data until 1961. Number of actual observations by date: 54.
Source name:
World Development Indicators
Source organization:
Food and Agriculture Organization, electronic files and web site.
Categories, topics:
Agriculture & Rural Development
Last updated:
apr 23, 2017
Indicators value changes by year
Maximum:
13.514
jan 1, 2005
At the date of observation
Value
Absolute change
Change from previous value
jan 1, 1962
7.674
+7.674
0.0%
jan 1, 1963
7.674
0.0
0.0%
jan 1, 1964
7.914
+0.24
3.13%
jan 1, 1965
8.058
+0.144
1.82%
jan 1, 1966
8.153
+0.096
1.19%
jan 1, 1967
8.153
0.0
0.0%
jan 1, 1968
8.201
+0.048
0.59%
jan 1, 1969
8.201
0.0
0.0%
jan 1, 1970
8.249
+0.048
0.58%
jan 1, 1971
8.393
+0.144
1.74%
jan 1, 1972
8.633
+0.24
2.86%
jan 1, 1973
8.777
+0.144
1.67%
jan 1, 1974
9.113
+0.336
3.83%
jan 1, 1975
9.592
+0.48
5.26%
jan 1, 1976
10.072
+0.48
5.0%
jan 1, 1977
10.376
+0.305
3.02%
jan 1, 1978
10.811
+0.434
4.19%
jan 1, 1979
10.859
+0.048
0.45%
jan 1, 1980
11.1
+0.241
2.22%
jan 1, 1981
11.68
+0.579
5.22%
jan 1, 1982
11.776
+0.097
0.83%
jan 1, 1983
12.162
+0.386
3.28%
jan 1, 1984
12.403
+0.241
1.98%
jan 1, 1985
12.403
0.0
0.0%
jan 1, 1986
12.403
0.0
0.0%
jan 1, 1987
12.403
0.0
0.0%
jan 1, 1988
12.403
0.0
0.0%
jan 1, 1989
12.403
0.0
0.0%
jan 1, 1990
12.403
0.0
0.0%
jan 1, 1991
12.548
+0.145
1.17%
jan 1, 1992
12.693
+0.145
1.15%
jan 1, 1993
12.693
0.0
0.0%
jan 1, 1994
12.79
+0.097
0.76%
jan 1, 1995
13.031
+0.241
1.89%
jan 1, 1996
13.176
+0.145
1.11%
jan 1, 1997
12.114
-1.062
-8.06%
jan 1, 1998
12.114
0.0
0.0%
jan 1, 1999
12.066
-0.048
-0.4%
jan 1, 2000
12.066
0.0
0.0%
jan 1, 2001
12.066
0.0
0.0%
jan 1, 2002
12.066
0.0
0.0%
jan 1, 2003
11.824
-0.241
-2.0%
jan 1, 2004
11.824
0.0
0.0%
jan 1, 2005
13.514
+1.689
14.29%
jan 1, 2006
10.956
-2.558
-18.93%
jan 1, 2007
11.293
+0.338
3.08%
jan 1, 2008
11.438
+0.145
1.28%
jan 1, 2009
11.1
-0.338
-2.95%
jan 1, 2011
10.859
-0.241
-2.17%
jan 1, 2012
10.376
-0.483
-4.44%
jan 1, 2013
10.376
0.0
0.0%
jan 1, 2014
10.376
0.0
0.0%
jan 1, 2015
10.376
0.0
0.0%
Ranking of countries by current statistics by years


Comments: