29
/
en
AIzaSyAYiBZKx7MnpbEhh9jyipgxe19OcubqV5w
April 1, 2024
123965
Ecuador
ECU
true
2
1
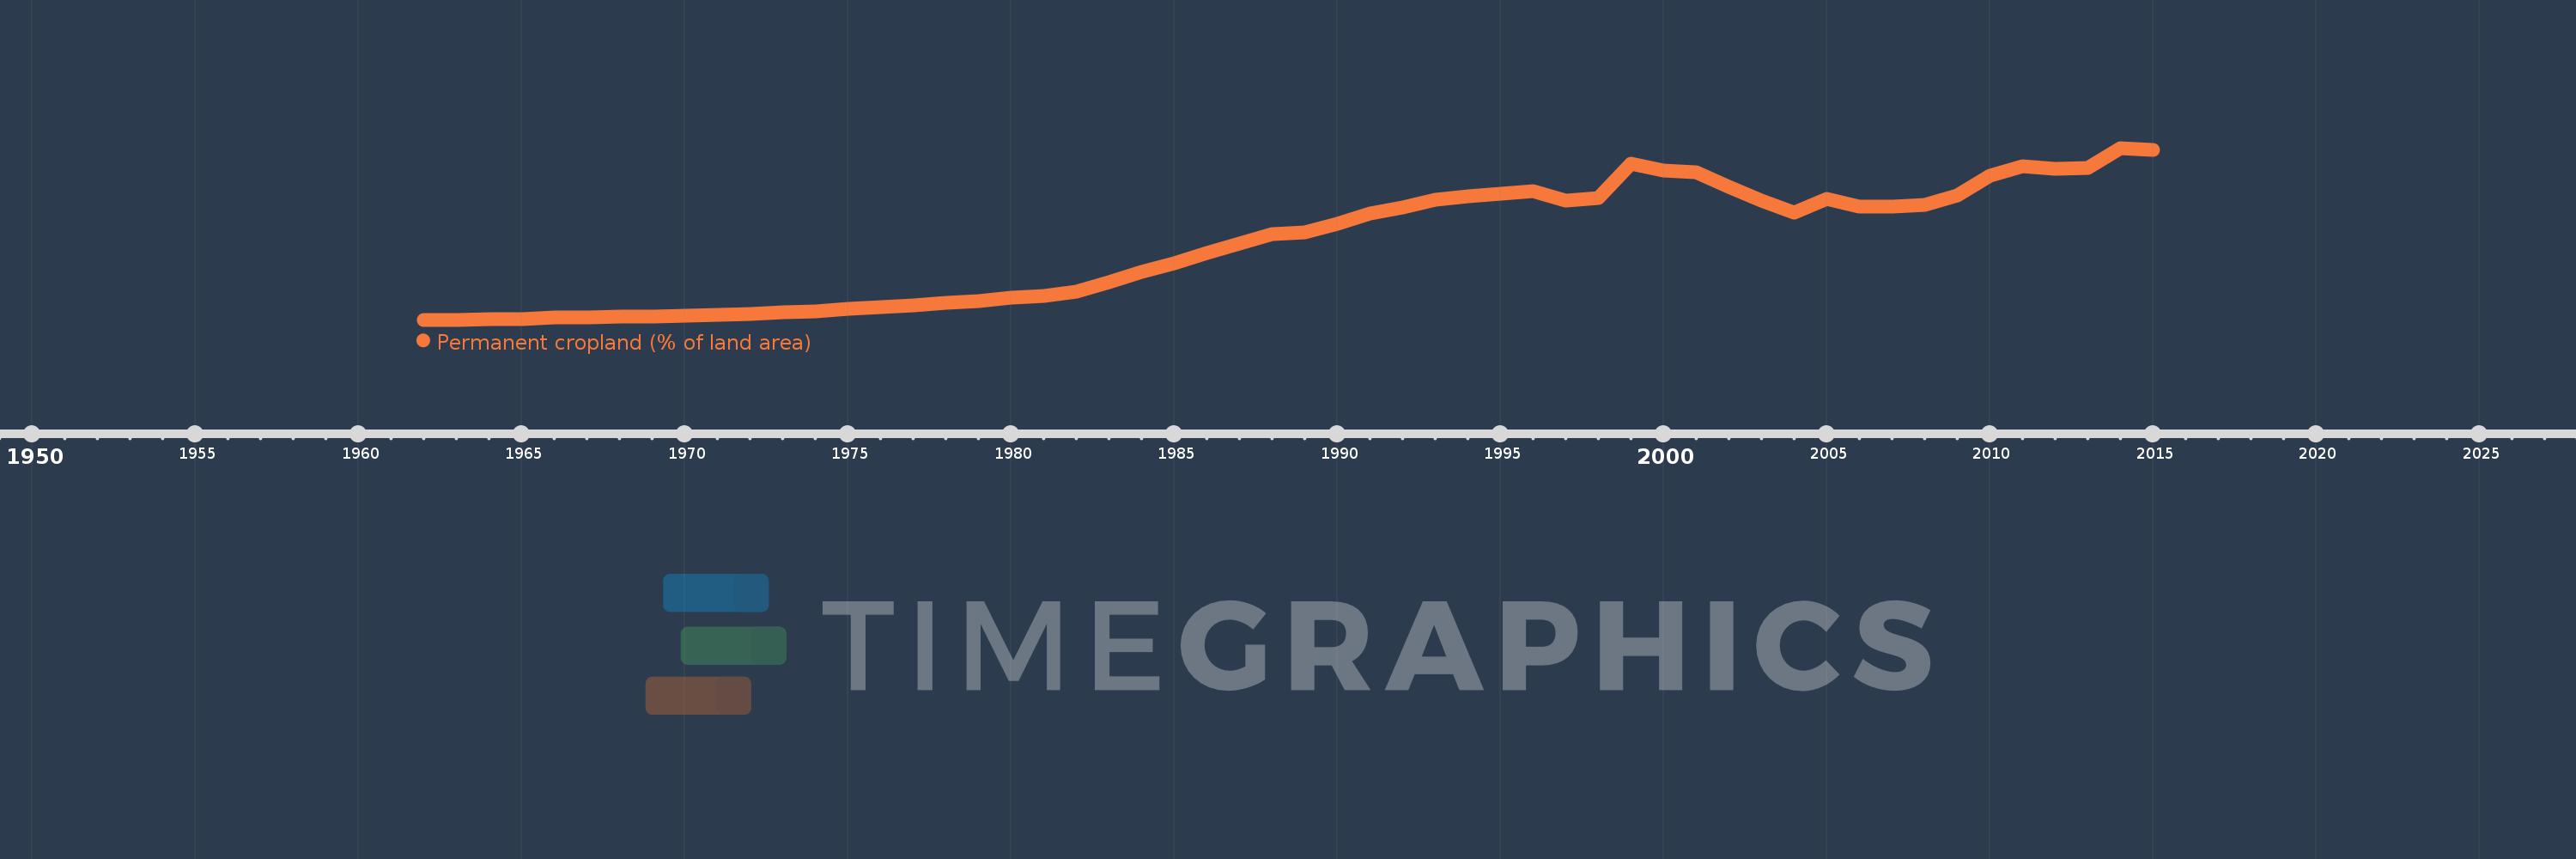
Permanent cropland (% of land area)
2015,2014,2013,2012,2011,2010,2009,2008,2007,2006,2005,2004,2003,2002,2001,2000,1999,1998,1997,1996,1995,1994,1993,1992,1991,1990,1989,1988,1987,1986,1985,1984,1983,1982,1981,1980,1979,1978,1977,1976,1975,1974,1973,1972,1971,1970,1969,1968,1967,1966,1965,1964,1963,1962
This statistics in other country:
AfghanistanAlbaniaAlgeriaAmerican SamoaAngolaAntigua and BarbudaArab WorldArgentinaArmeniaAustraliaAustriaAzerbaijanBahamas, TheBahrainBangladeshBarbadosBelarusBelgiumBelizeBeninBhutanBoliviaBosnia and HerzegovinaBotswanaBrazilBritish Virgin IslandsBrunei DarussalamBulgariaBurkina FasoBurundiCabo VerdeCambodiaCameroonCanadaCaribbean small statesCayman IslandsCentral African RepublicCentral Europe and the BalticsChadChileChinaColombiaComorosCongo, Dem. Rep.Congo, Rep.Costa RicaCote d'IvoireCroatiaCubaCyprusCzech RepublicDenmarkDominicaDominican RepublicEarly-demographic dividendEast Asia & PacificEast Asia & Pacific (excluding high income)East Asia & Pacific (IDA & IBRD countries)EcuadorEgypt, Arab Rep.El SalvadorEquatorial GuineaEritreaEstoniaEthiopiaEuro areaEurope & Central AsiaEurope & Central Asia (excluding high income)Europe & Central Asia (IDA & IBRD countries)European UnionFijiFinlandFragile and conflict affected situationsFranceFrench PolynesiaGabonGambia, TheGeorgiaGermanyGhanaGreeceGrenadaGuamGuatemalaGuineaGuinea-BissauGuyanaHaitiHeavily indebted poor countries (HIPC)High incomeHondurasHong Kong SAR, ChinaHungaryIBRD onlyIDA & IBRD totalIDA blendIDA onlyIDA totalIndiaIndonesiaIran, Islamic Rep.IraqIrelandIsraelItalyJamaicaJapanJordanKazakhstanKenyaKiribatiKorea, Dem. People’s Rep.Korea, Rep.KuwaitKyrgyz RepublicLao PDRLate-demographic dividendLatin America & Caribbean Latin America & Caribbean (excluding high income)Latin America & the Caribbean (IDA & IBRD countries)LatviaLeast developed countries: UN classificationLebanonLesothoLiberiaLibyaLithuaniaLow & middle incomeLow incomeLower middle incomeLuxembourgMacedonia, FYRMadagascarMalawiMalaysiaMaldivesMaliMaltaMarshall IslandsMauritaniaMauritiusMexicoMicronesia, Fed. Sts.Middle East & North AfricaMiddle East & North Africa (excluding high income)Middle East & North Africa (IDA & IBRD countries)Middle incomeMoldovaMongoliaMontenegroMoroccoMozambiqueMyanmarNamibiaNauruNepalNetherlandsNew CaledoniaNew ZealandNicaraguaNigerNigeriaNorth AmericaNorthern Mariana IslandsNorwayOECD membersOmanOther small statesPacific island small statesPakistanPalauPanamaPapua New GuineaParaguayPeruPhilippinesPolandPortugalPost-demographic dividendPre-demographic dividendPuerto RicoQatarRomaniaRussian FederationRwandaSamoaSao Tome and PrincipeSaudi ArabiaSenegalSerbiaSeychellesSierra LeoneSingaporeSlovak RepublicSloveniaSmall statesSolomon IslandsSomaliaSouth AfricaSouth AsiaSouth Asia (IDA & IBRD)SpainSri LankaSt. Kitts and NevisSt. LuciaSt. Vincent and the GrenadinesSub-Saharan Africa Sub-Saharan Africa (excluding high income)Sub-Saharan Africa (IDA & IBRD countries)SudanSurinameSwazilandSwedenSwitzerlandSyrian Arab RepublicTajikistanTanzaniaThailandTimor-LesteTogoTongaTrinidad and TobagoTunisiaTurkeyTurkmenistanTuvaluUgandaUkraineUnited Arab EmiratesUnited KingdomUnited StatesUpper middle incomeUruguayUzbekistanVanuatuVenezuela, RBVietnamVirgin Islands (U.S.)West Bank and GazaWorldYemen, Rep.ZambiaZimbabwe Timeline:
This timeline shows a graph from 1962 to 2015 of Ecuador. No data until 1961. Number of actual observations by date: 54.
Source name:
World Development Indicators
Source organization:
Food and Agriculture Organization, electronic files and web site.
Categories, topics:
Agriculture & Rural Development
Last updated:
apr 23, 2017
Indicators value changes by year
At the date of observation
Value
Absolute change
Change from previous value
jan 1, 1962
2.908
+2.908
0.0%
jan 1, 1963
2.908
0.0
0.0%
jan 1, 1964
2.926
+0.018
0.62%
jan 1, 1965
2.926
0.0
0.0%
jan 1, 1966
2.944
+0.018
0.62%
jan 1, 1967
2.944
0.0
0.0%
jan 1, 1968
2.962
+0.018
0.61%
jan 1, 1969
2.962
0.0
0.0%
jan 1, 1970
2.98
+0.018
0.61%
jan 1, 1971
2.998
+0.018
0.61%
jan 1, 1972
3.016
+0.018
0.6%
jan 1, 1973
3.034
+0.018
0.6%
jan 1, 1974
3.052
+0.018
0.6%
jan 1, 1975
3.092
+0.04
1.3%
jan 1, 1976
3.125
+0.033
1.05%
jan 1, 1977
3.161
+0.036
1.16%
jan 1, 1978
3.197
+0.036
1.14%
jan 1, 1979
3.233
+0.036
1.13%
jan 1, 1980
3.287
+0.054
1.68%
jan 1, 1981
3.323
+0.036
1.1%
jan 1, 1982
3.403
+0.079
2.39%
jan 1, 1983
3.569
+0.166
4.88%
jan 1, 1984
3.739
+0.17
4.76%
jan 1, 1985
3.901
+0.163
4.35%
jan 1, 1986
4.082
+0.181
4.63%
jan 1, 1987
4.244
+0.163
3.98%
jan 1, 1988
4.407
+0.163
3.83%
jan 1, 1989
4.432
+0.025
0.57%
jan 1, 1990
4.587
+0.155
3.5%
jan 1, 1991
4.772
+0.184
4.02%
jan 1, 1992
4.88
+0.108
2.27%
jan 1, 1993
5.01
+0.13
2.66%
jan 1, 1994
5.075
+0.065
1.3%
jan 1, 1995
5.111
+0.036
0.71%
jan 1, 1996
5.155
+0.043
0.85%
jan 1, 1997
4.999
-0.155
-3.01%
jan 1, 1998
5.039
+0.04
0.79%
jan 1, 1999
5.645
+0.606
12.03%
jan 1, 2000
5.516
-0.129
-2.28%
jan 1, 2001
5.488
-0.028
-0.51%
jan 1, 2002
5.234
-0.254
-4.62%
jan 1, 2003
4.993
-0.242
-4.62%
jan 1, 2004
4.783
-0.209
-4.19%
jan 1, 2005
5.017
+0.234
4.88%
jan 1, 2006
4.888
-0.129
-2.57%
jan 1, 2007
4.884
-0.004
-0.08%
jan 1, 2008
4.912
+0.028
0.58%
jan 1, 2009
5.089
+0.177
3.61%
jan 1, 2010
5.432
+0.342
6.72%
jan 1, 2011
5.602
+0.171
3.14%
jan 1, 2012
5.554
-0.048
-0.86%
jan 1, 2013
5.569
+0.014
0.25%
jan 1, 2014
5.915
+0.346
6.22%
jan 1, 2015
5.883
-0.032
-0.54%
Ranking of countries by current statistics by years


Comments: