29
/
en
AIzaSyAYiBZKx7MnpbEhh9jyipgxe19OcubqV5w
April 1, 2024
61091
Sub-Saharan Africa (IDA & IBRD countries)
TSS
false
2
1
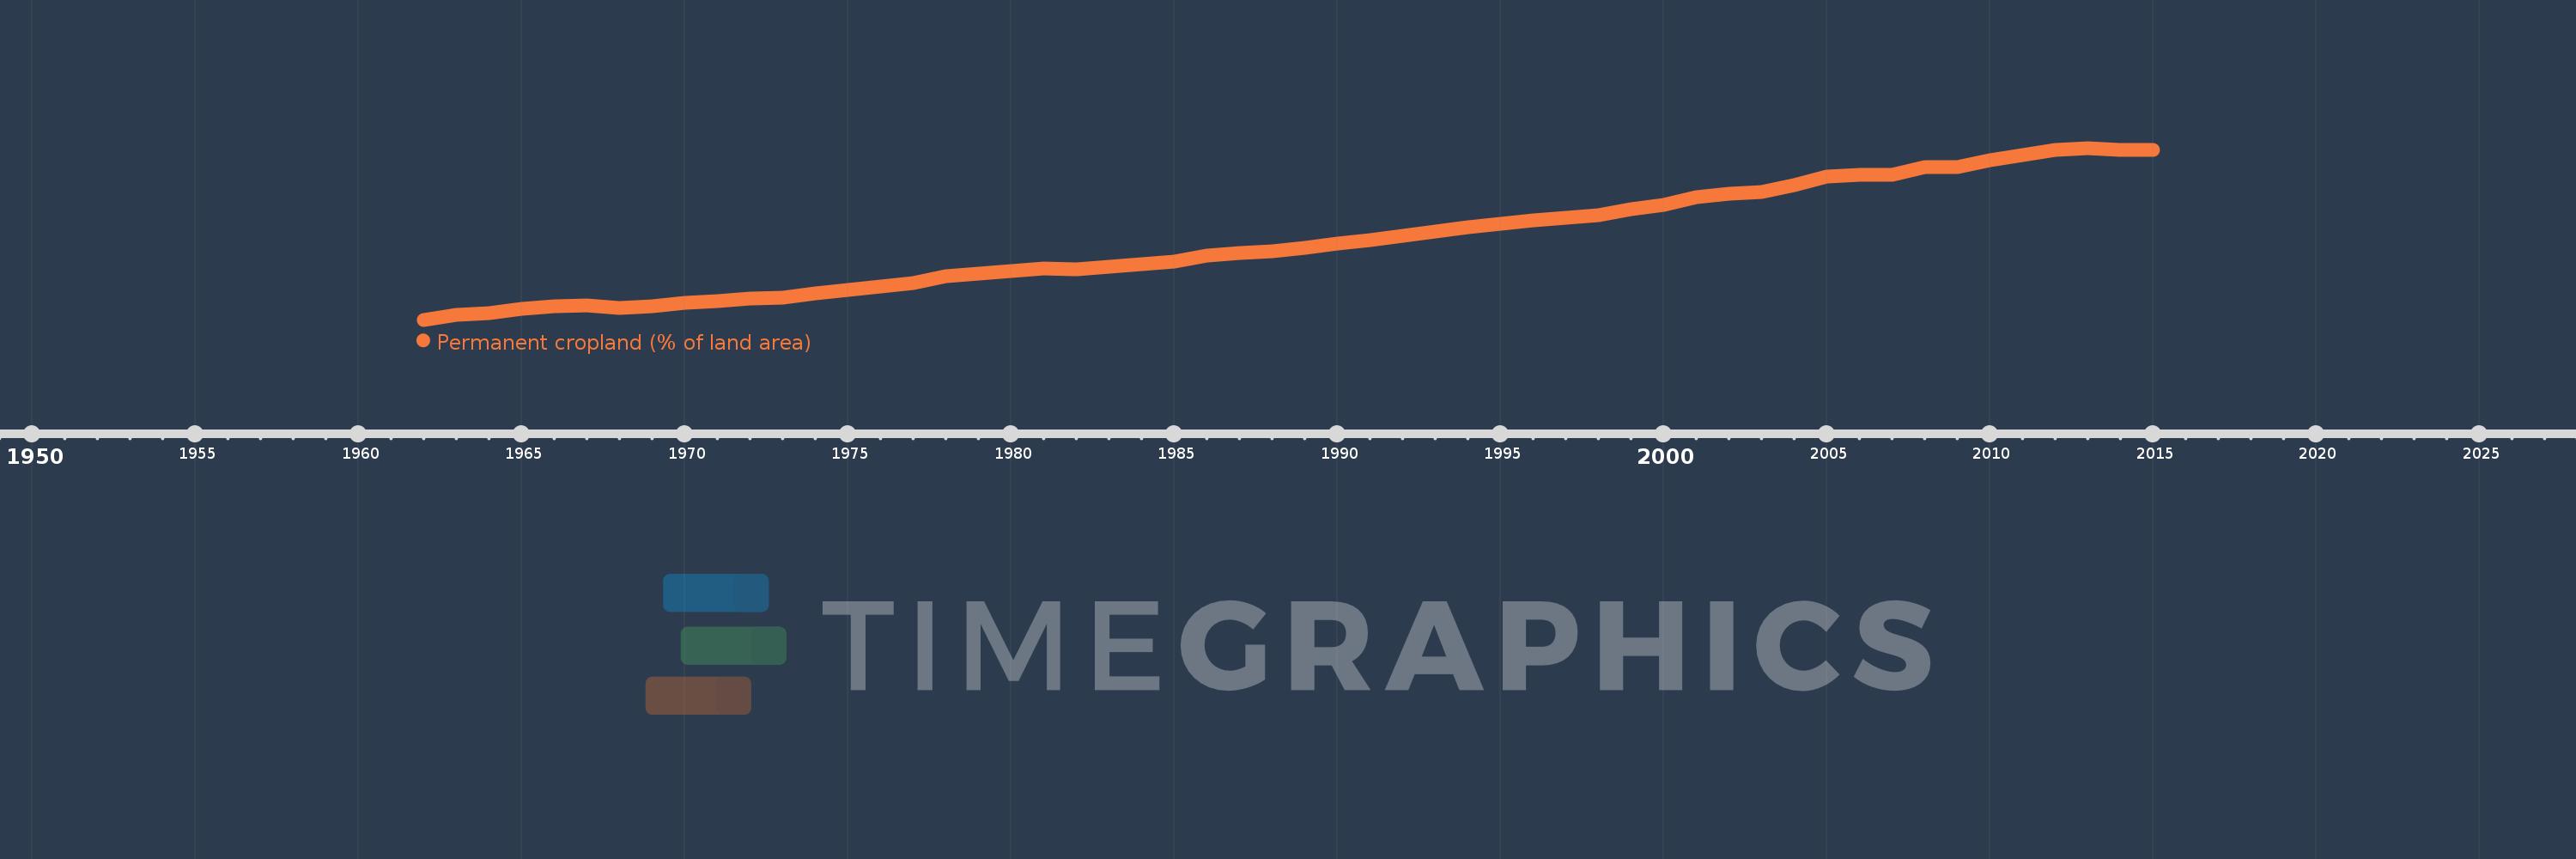
Permanent cropland (% of land area)
2015,2014,2013,2012,2011,2010,2009,2008,2007,2006,2005,2004,2003,2002,2001,2000,1999,1998,1997,1996,1995,1994,1993,1992,1991,1990,1989,1988,1987,1986,1985,1984,1983,1982,1981,1980,1979,1978,1977,1976,1975,1974,1973,1972,1971,1970,1969,1968,1967,1966,1965,1964,1963,1962
This statistics in other country:
AfghanistanAlbaniaAlgeriaAmerican SamoaAngolaAntigua and BarbudaArab WorldArgentinaArmeniaAustraliaAustriaAzerbaijanBahamas, TheBahrainBangladeshBarbadosBelarusBelgiumBelizeBeninBhutanBoliviaBosnia and HerzegovinaBotswanaBrazilBritish Virgin IslandsBrunei DarussalamBulgariaBurkina FasoBurundiCabo VerdeCambodiaCameroonCanadaCaribbean small statesCayman IslandsCentral African RepublicCentral Europe and the BalticsChadChileChinaColombiaComorosCongo, Dem. Rep.Congo, Rep.Costa RicaCote d'IvoireCroatiaCubaCyprusCzech RepublicDenmarkDominicaDominican RepublicEarly-demographic dividendEast Asia & PacificEast Asia & Pacific (excluding high income)East Asia & Pacific (IDA & IBRD countries)EcuadorEgypt, Arab Rep.El SalvadorEquatorial GuineaEritreaEstoniaEthiopiaEuro areaEurope & Central AsiaEurope & Central Asia (excluding high income)Europe & Central Asia (IDA & IBRD countries)European UnionFijiFinlandFragile and conflict affected situationsFranceFrench PolynesiaGabonGambia, TheGeorgiaGermanyGhanaGreeceGrenadaGuamGuatemalaGuineaGuinea-BissauGuyanaHaitiHeavily indebted poor countries (HIPC)High incomeHondurasHong Kong SAR, ChinaHungaryIBRD onlyIDA & IBRD totalIDA blendIDA onlyIDA totalIndiaIndonesiaIran, Islamic Rep.IraqIrelandIsraelItalyJamaicaJapanJordanKazakhstanKenyaKiribatiKorea, Dem. People’s Rep.Korea, Rep.KuwaitKyrgyz RepublicLao PDRLate-demographic dividendLatin America & Caribbean Latin America & Caribbean (excluding high income)Latin America & the Caribbean (IDA & IBRD countries)LatviaLeast developed countries: UN classificationLebanonLesothoLiberiaLibyaLithuaniaLow & middle incomeLow incomeLower middle incomeLuxembourgMacedonia, FYRMadagascarMalawiMalaysiaMaldivesMaliMaltaMarshall IslandsMauritaniaMauritiusMexicoMicronesia, Fed. Sts.Middle East & North AfricaMiddle East & North Africa (excluding high income)Middle East & North Africa (IDA & IBRD countries)Middle incomeMoldovaMongoliaMontenegroMoroccoMozambiqueMyanmarNamibiaNauruNepalNetherlandsNew CaledoniaNew ZealandNicaraguaNigerNigeriaNorth AmericaNorthern Mariana IslandsNorwayOECD membersOmanOther small statesPacific island small statesPakistanPalauPanamaPapua New GuineaParaguayPeruPhilippinesPolandPortugalPost-demographic dividendPre-demographic dividendPuerto RicoQatarRomaniaRussian FederationRwandaSamoaSao Tome and PrincipeSaudi ArabiaSenegalSerbiaSeychellesSierra LeoneSingaporeSlovak RepublicSloveniaSmall statesSolomon IslandsSomaliaSouth AfricaSouth AsiaSouth Asia (IDA & IBRD)SpainSri LankaSt. Kitts and NevisSt. LuciaSt. Vincent and the GrenadinesSub-Saharan Africa Sub-Saharan Africa (excluding high income)Sub-Saharan Africa (IDA & IBRD countries)SudanSurinameSwazilandSwedenSwitzerlandSyrian Arab RepublicTajikistanTanzaniaThailandTimor-LesteTogoTongaTrinidad and TobagoTunisiaTurkeyTurkmenistanTuvaluUgandaUkraineUnited Arab EmiratesUnited KingdomUnited StatesUpper middle incomeUruguayUzbekistanVanuatuVenezuela, RBVietnamVirgin Islands (U.S.)West Bank and GazaWorldYemen, Rep.ZambiaZimbabwe Timeline:
This timeline shows a graph from 1962 to 2015 of Sub-Saharan Africa (IDA & IBRD countries). No data until 1961. Number of actual observations by date: 54.
Source name:
World Development Indicators
Source organization:
Food and Agriculture Organization, electronic files and web site.
Categories, topics:
Agriculture & Rural Development
Last updated:
apr 23, 2017
Indicators value changes by year
At the date of observation
Value
Absolute change
Change from previous value
jan 1, 1962
0.537
+0.537
0.0%
jan 1, 1963
0.556
+0.019
3.63%
jan 1, 1964
0.561
+0.004
0.81%
jan 1, 1965
0.578
+0.017
3.1%
jan 1, 1966
0.589
+0.011
1.85%
jan 1, 1967
0.591
+0.002
0.27%
jan 1, 1968
0.582
-0.008
-1.37%
jan 1, 1969
0.589
+0.007
1.16%
jan 1, 1970
0.6
+0.011
1.85%
jan 1, 1971
0.607
+0.007
1.15%
jan 1, 1972
0.616
+0.009
1.45%
jan 1, 1973
0.622
+0.006
1.02%
jan 1, 1974
0.635
+0.013
2.08%
jan 1, 1975
0.649
+0.014
2.18%
jan 1, 1976
0.664
+0.015
2.34%
jan 1, 1977
0.677
+0.013
2.0%
jan 1, 1978
0.7
+0.023
3.35%
jan 1, 1979
0.71
+0.01
1.43%
jan 1, 1980
0.72
+0.01
1.42%
jan 1, 1981
0.73
+0.01
1.39%
jan 1, 1982
0.728
-0.002
-0.32%
jan 1, 1983
0.738
+0.01
1.37%
jan 1, 1984
0.746
+0.008
1.07%
jan 1, 1985
0.758
+0.012
1.67%
jan 1, 1986
0.779
+0.02
2.7%
jan 1, 1987
0.788
+0.009
1.21%
jan 1, 1988
0.795
+0.007
0.84%
jan 1, 1989
0.809
+0.015
1.83%
jan 1, 1990
0.825
+0.016
1.96%
jan 1, 1991
0.839
+0.013
1.63%
jan 1, 1992
0.855
+0.017
1.99%
jan 1, 1993
0.87
+0.014
1.69%
jan 1, 1994
0.887
+0.017
1.99%
jan 1, 1995
0.901
+0.014
1.55%
jan 1, 1996
0.914
+0.013
1.45%
jan 1, 1997
0.921
+0.007
0.8%
jan 1, 1998
0.931
+0.01
1.05%
jan 1, 1999
0.955
+0.024
2.59%
jan 1, 2000
0.971
+0.016
1.72%
jan 1, 2001
1.0
+0.029
2.98%
jan 1, 2002
1.014
+0.014
1.36%
jan 1, 2003
1.019
+0.005
0.45%
jan 1, 2004
1.044
+0.026
2.54%
jan 1, 2005
1.079
+0.035
3.34%
jan 1, 2006
1.086
+0.007
0.63%
jan 1, 2007
1.086
+0.0
0.03%
jan 1, 2008
1.115
+0.028
2.61%
jan 1, 2009
1.114
-0.001
-0.08%
jan 1, 2010
1.141
+0.027
2.43%
jan 1, 2011
1.158
+0.017
1.52%
jan 1, 2012
1.177
+0.019
1.64%
jan 1, 2013
1.186
+0.008
0.71%
jan 1, 2014
1.178
-0.007
-0.62%
jan 1, 2015
1.179
+0.0
0.03%
Ranking of countries by current statistics by years


Comments: