29
/
en
AIzaSyAYiBZKx7MnpbEhh9jyipgxe19OcubqV5w
April 1, 2024
186983
Malawi
MWI
true
2
1
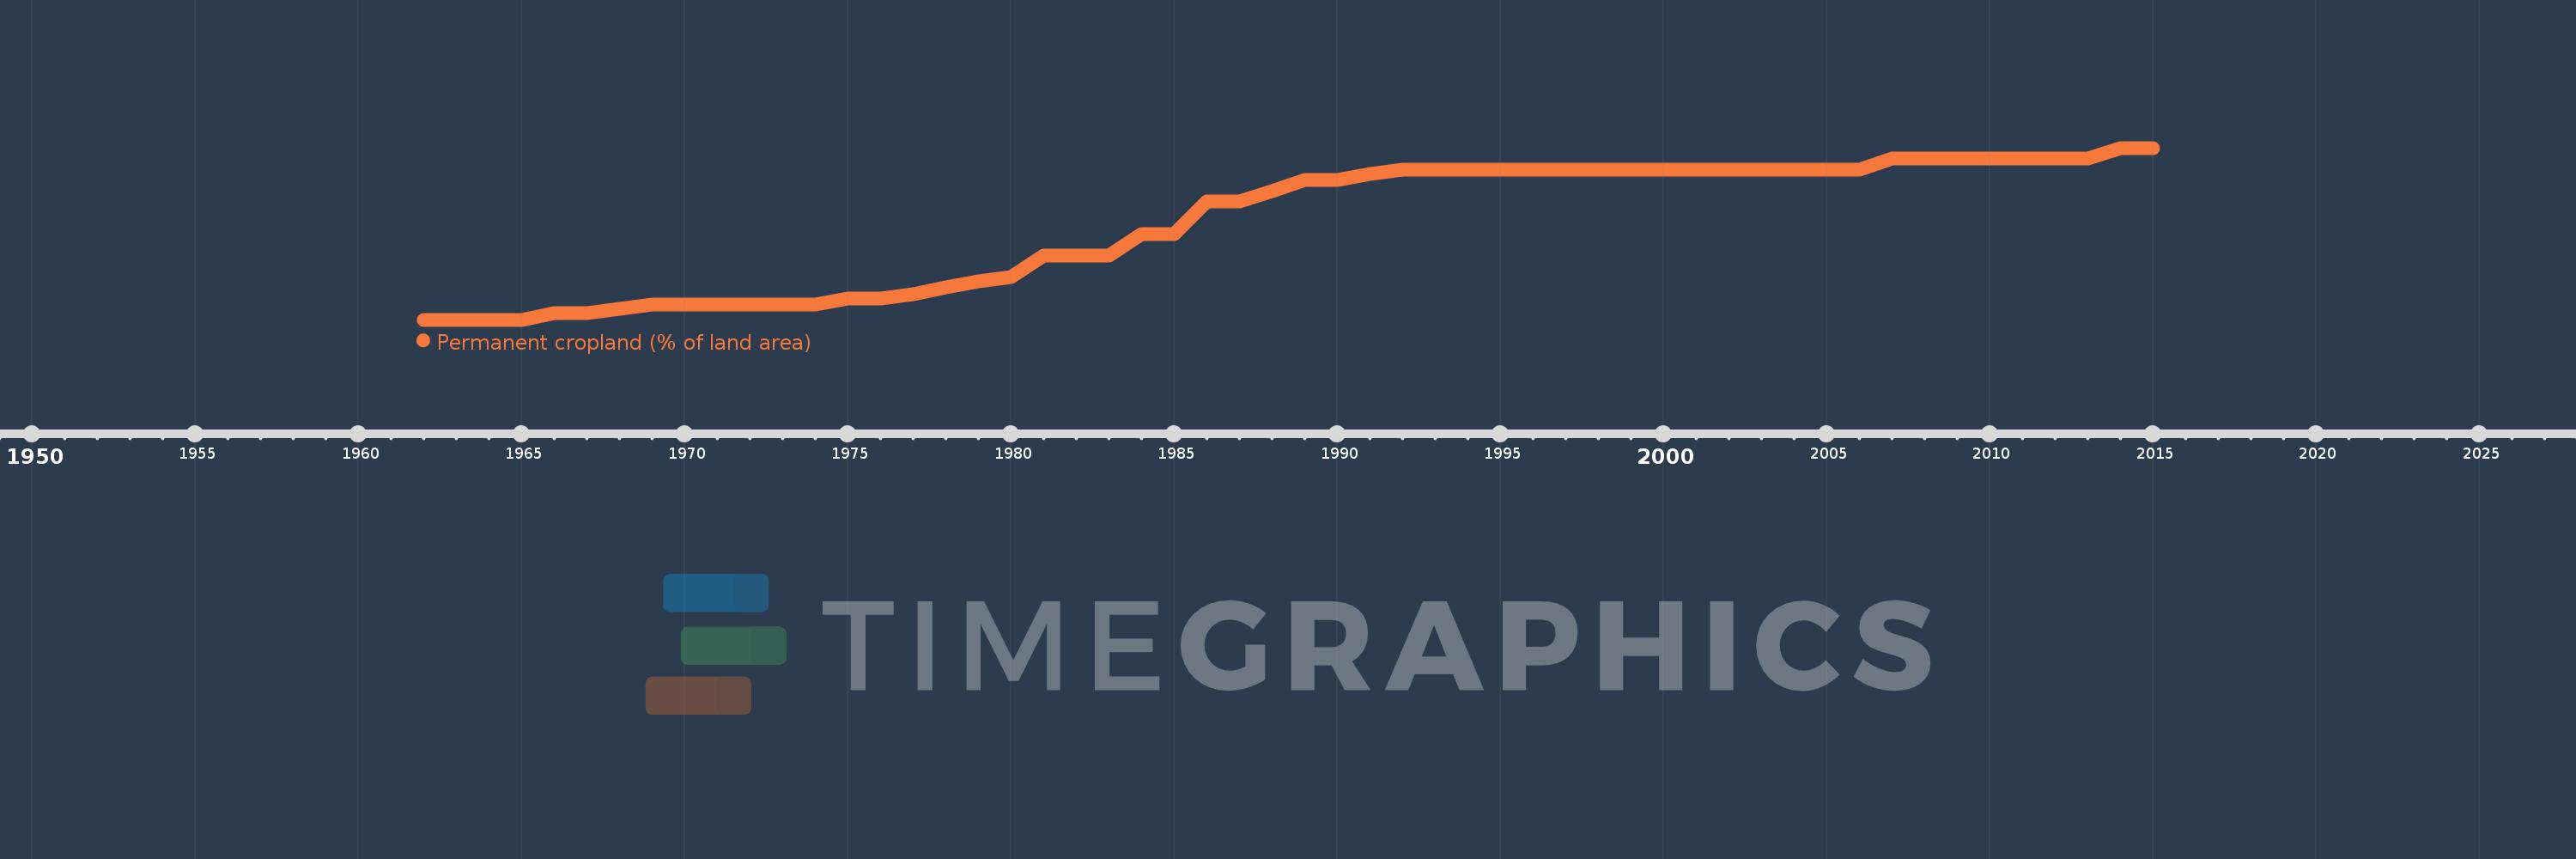
Permanent cropland (% of land area)
2015,2014,2013,2012,2011,2010,2009,2008,2007,2006,2005,2004,2003,2002,2001,2000,1999,1998,1997,1996,1995,1994,1993,1992,1991,1990,1989,1988,1987,1986,1985,1984,1983,1982,1981,1980,1979,1978,1977,1976,1975,1974,1973,1972,1971,1970,1969,1968,1967,1966,1965,1964,1963,1962
This statistics in other country:
AfghanistanAlbaniaAlgeriaAmerican SamoaAngolaAntigua and BarbudaArab WorldArgentinaArmeniaAustraliaAustriaAzerbaijanBahamas, TheBahrainBangladeshBarbadosBelarusBelgiumBelizeBeninBhutanBoliviaBosnia and HerzegovinaBotswanaBrazilBritish Virgin IslandsBrunei DarussalamBulgariaBurkina FasoBurundiCabo VerdeCambodiaCameroonCanadaCaribbean small statesCayman IslandsCentral African RepublicCentral Europe and the BalticsChadChileChinaColombiaComorosCongo, Dem. Rep.Congo, Rep.Costa RicaCote d'IvoireCroatiaCubaCyprusCzech RepublicDenmarkDominicaDominican RepublicEarly-demographic dividendEast Asia & PacificEast Asia & Pacific (excluding high income)East Asia & Pacific (IDA & IBRD countries)EcuadorEgypt, Arab Rep.El SalvadorEquatorial GuineaEritreaEstoniaEthiopiaEuro areaEurope & Central AsiaEurope & Central Asia (excluding high income)Europe & Central Asia (IDA & IBRD countries)European UnionFijiFinlandFragile and conflict affected situationsFranceFrench PolynesiaGabonGambia, TheGeorgiaGermanyGhanaGreeceGrenadaGuamGuatemalaGuineaGuinea-BissauGuyanaHaitiHeavily indebted poor countries (HIPC)High incomeHondurasHong Kong SAR, ChinaHungaryIBRD onlyIDA & IBRD totalIDA blendIDA onlyIDA totalIndiaIndonesiaIran, Islamic Rep.IraqIrelandIsraelItalyJamaicaJapanJordanKazakhstanKenyaKiribatiKorea, Dem. People’s Rep.Korea, Rep.KuwaitKyrgyz RepublicLao PDRLate-demographic dividendLatin America & Caribbean Latin America & Caribbean (excluding high income)Latin America & the Caribbean (IDA & IBRD countries)LatviaLeast developed countries: UN classificationLebanonLesothoLiberiaLibyaLithuaniaLow & middle incomeLow incomeLower middle incomeLuxembourgMacedonia, FYRMadagascarMalawiMalaysiaMaldivesMaliMaltaMarshall IslandsMauritaniaMauritiusMexicoMicronesia, Fed. Sts.Middle East & North AfricaMiddle East & North Africa (excluding high income)Middle East & North Africa (IDA & IBRD countries)Middle incomeMoldovaMongoliaMontenegroMoroccoMozambiqueMyanmarNamibiaNauruNepalNetherlandsNew CaledoniaNew ZealandNicaraguaNigerNigeriaNorth AmericaNorthern Mariana IslandsNorwayOECD membersOmanOther small statesPacific island small statesPakistanPalauPanamaPapua New GuineaParaguayPeruPhilippinesPolandPortugalPost-demographic dividendPre-demographic dividendPuerto RicoQatarRomaniaRussian FederationRwandaSamoaSao Tome and PrincipeSaudi ArabiaSenegalSerbiaSeychellesSierra LeoneSingaporeSlovak RepublicSloveniaSmall statesSolomon IslandsSomaliaSouth AfricaSouth AsiaSouth Asia (IDA & IBRD)SpainSri LankaSt. Kitts and NevisSt. LuciaSt. Vincent and the GrenadinesSub-Saharan Africa Sub-Saharan Africa (excluding high income)Sub-Saharan Africa (IDA & IBRD countries)SudanSurinameSwazilandSwedenSwitzerlandSyrian Arab RepublicTajikistanTanzaniaThailandTimor-LesteTogoTongaTrinidad and TobagoTunisiaTurkeyTurkmenistanTuvaluUgandaUkraineUnited Arab EmiratesUnited KingdomUnited StatesUpper middle incomeUruguayUzbekistanVanuatuVenezuela, RBVietnamVirgin Islands (U.S.)West Bank and GazaWorldYemen, Rep.ZambiaZimbabwe Timeline:
This timeline shows a graph from 1962 to 2015 of Malawi. No data until 1961. Number of actual observations by date: 54.
Source name:
World Development Indicators
Source organization:
Food and Agriculture Organization, electronic files and web site.
Categories, topics:
Agriculture & Rural Development
Last updated:
apr 23, 2017
Indicators value changes by year
At the date of observation
Value
Absolute change
Change from previous value
jan 1, 1962
0.636
+0.636
0.0%
jan 1, 1963
0.636
0.0
0.0%
jan 1, 1964
0.636
0.0
0.0%
jan 1, 1965
0.636
0.0
0.0%
jan 1, 1966
0.668
+0.032
5.0%
jan 1, 1967
0.668
0.0
0.0%
jan 1, 1968
0.689
+0.021
3.17%
jan 1, 1969
0.711
+0.021
3.08%
jan 1, 1970
0.711
0.0
0.0%
jan 1, 1971
0.711
0.0
0.0%
jan 1, 1972
0.711
0.0
0.0%
jan 1, 1973
0.711
0.0
0.0%
jan 1, 1974
0.711
0.0
0.0%
jan 1, 1975
0.742
+0.032
4.48%
jan 1, 1976
0.742
0.0
0.0%
jan 1, 1977
0.764
+0.021
2.86%
jan 1, 1978
0.796
+0.032
4.17%
jan 1, 1979
0.827
+0.032
4.0%
jan 1, 1980
0.849
+0.021
2.56%
jan 1, 1981
0.955
+0.106
12.5%
jan 1, 1982
0.955
0.0
0.0%
jan 1, 1983
0.955
0.0
0.0%
jan 1, 1984
1.061
+0.106
11.11%
jan 1, 1985
1.061
0.0
0.0%
jan 1, 1986
1.22
+0.159
15.0%
jan 1, 1988
1.273
+0.053
4.35%
jan 1, 1989
1.326
+0.053
4.17%
jan 1, 1990
1.326
0.0
0.0%
jan 1, 1991
1.358
+0.032
2.4%
jan 1, 1992
1.379
+0.021
1.56%
jan 1, 1993
1.379
0.0
0.0%
jan 1, 1994
1.379
0.0
0.0%
jan 1, 1995
1.379
0.0
0.0%
jan 1, 1996
1.379
0.0
0.0%
jan 1, 1997
1.379
0.0
0.0%
jan 1, 1998
1.379
0.0
0.0%
jan 1, 1999
1.379
0.0
0.0%
jan 1, 2000
1.379
0.0
0.0%
jan 1, 2001
1.379
0.0
0.0%
jan 1, 2002
1.379
0.0
0.0%
jan 1, 2003
1.379
0.0
0.0%
jan 1, 2004
1.379
0.0
0.0%
jan 1, 2005
1.379
0.0
0.0%
jan 1, 2006
1.379
0.0
0.0%
jan 1, 2007
1.432
+0.053
3.85%
jan 1, 2008
1.432
0.0
0.0%
jan 1, 2009
1.432
0.0
0.0%
jan 1, 2010
1.432
0.0
0.0%
jan 1, 2011
1.432
0.0
0.0%
jan 1, 2012
1.432
0.0
0.0%
jan 1, 2013
1.432
0.0
0.0%
jan 1, 2014
1.485
+0.053
3.7%
jan 1, 2015
1.485
0.0
0.0%
Ranking of countries by current statistics by years


Comments: