Download This statistics in other country:
Timeline:
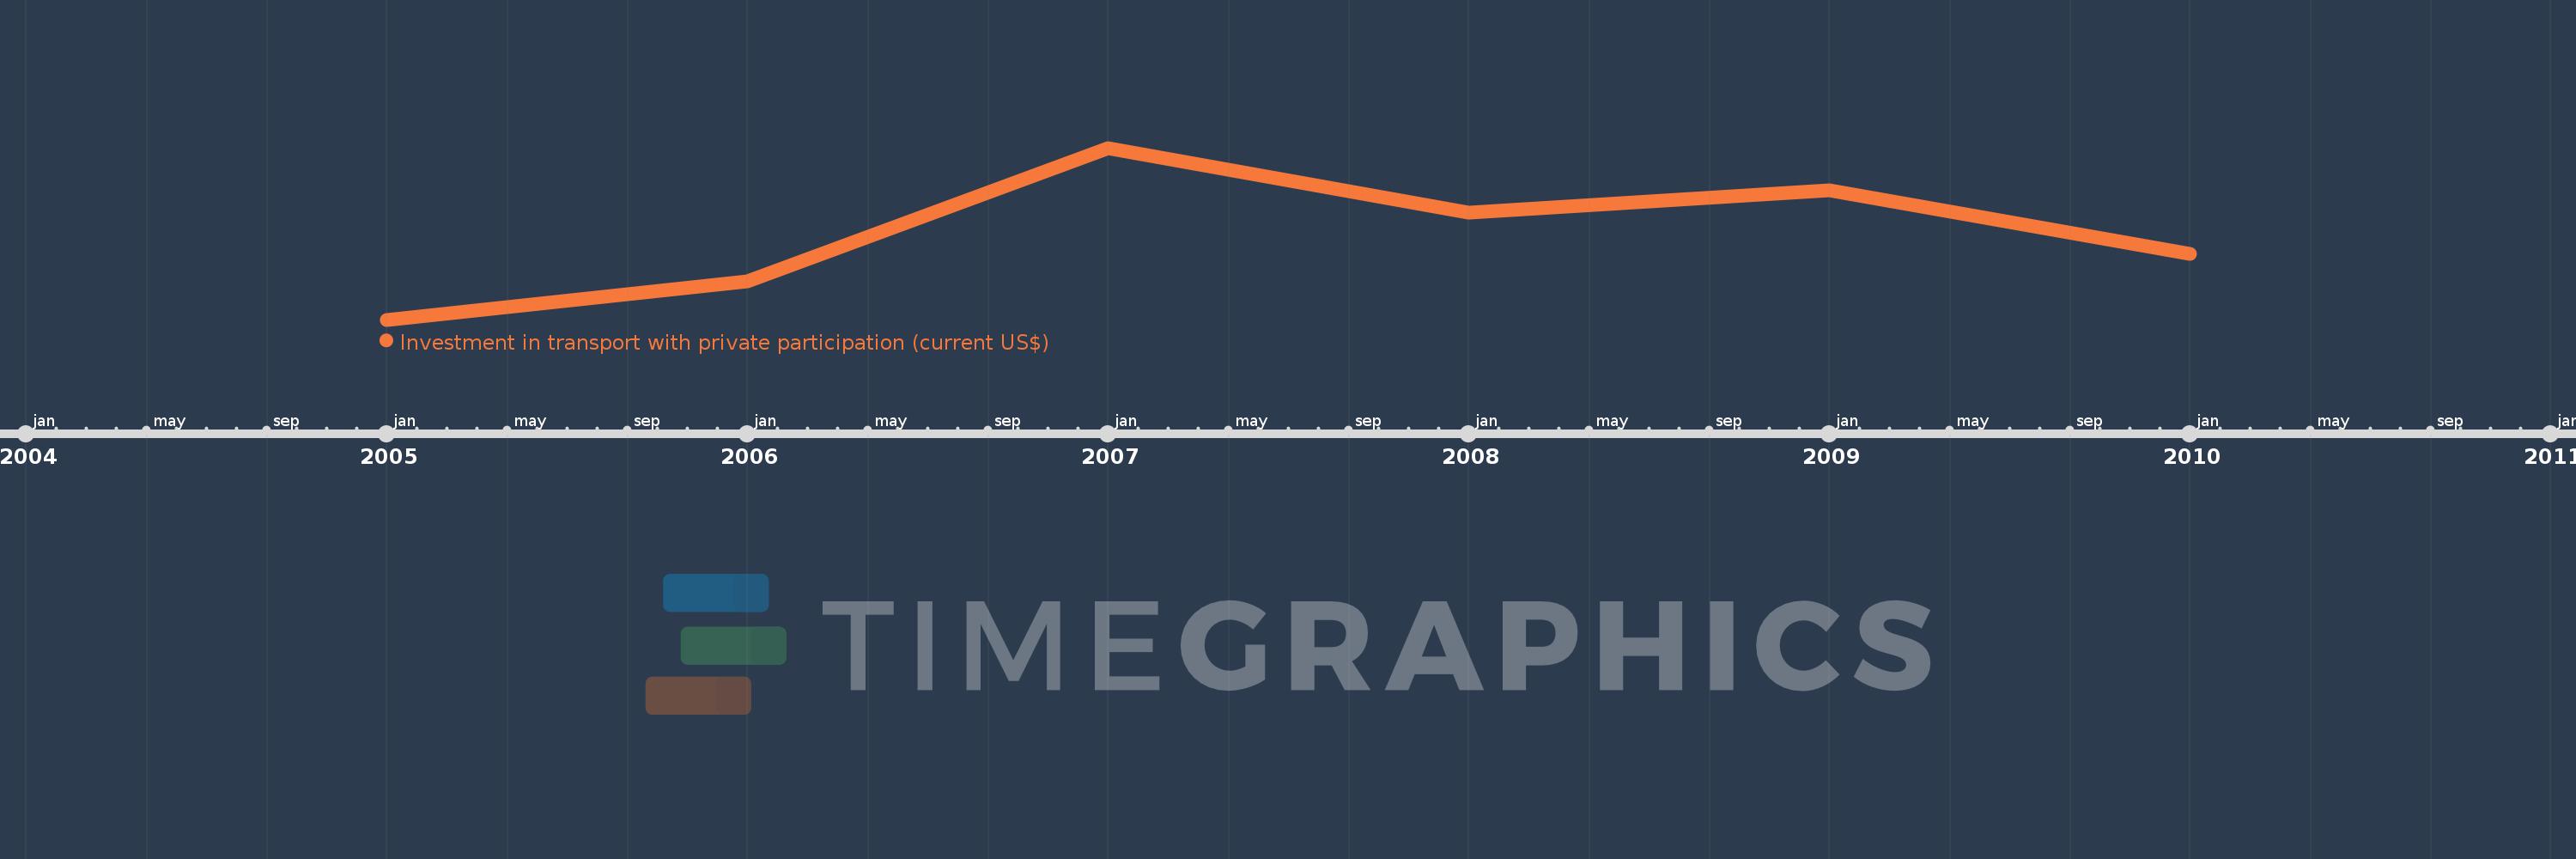
This timeline shows a graph from 2005 to 2010 of Lower middle income. No data until 2004. Number of actual observations by date: 6.
Source name:
World Development Indicators
Source organization:
World Bank, Private Participation in Infrastructure Project Database (http://ppi.worldbank.org).
Categories, topics:
Infrastructure, Private Sector
Last updated:
apr 23, 2017
Indicators value changes by year
Minimum:
1.834 bln
jan 1, 2005
Maximum:
11.621 bln
jan 1, 2007
At the date of observation
Value
Absolute change
Change from the previous value
jan 1, 2005
1.834 bln
+1.834 bln
0.0%
jan 1, 2006
4.032 bln
+2.198 bln
119.84%
jan 1, 2007
11.621 bln
+7.589 bln
188.22%
jan 1, 2008
7.943 bln
-3.678 bln
-31.65%
jan 1, 2009
9.204 bln
+1.261 bln
15.88%
jan 1, 2010
5.564 bln
-3.64 bln
-39.55%
Ranking of countries by current statistics by years
