29
/
en
AIzaSyAYiBZKx7MnpbEhh9jyipgxe19OcubqV5w
April 1, 2024
203119
Mozambique
MOZ
true
2
1
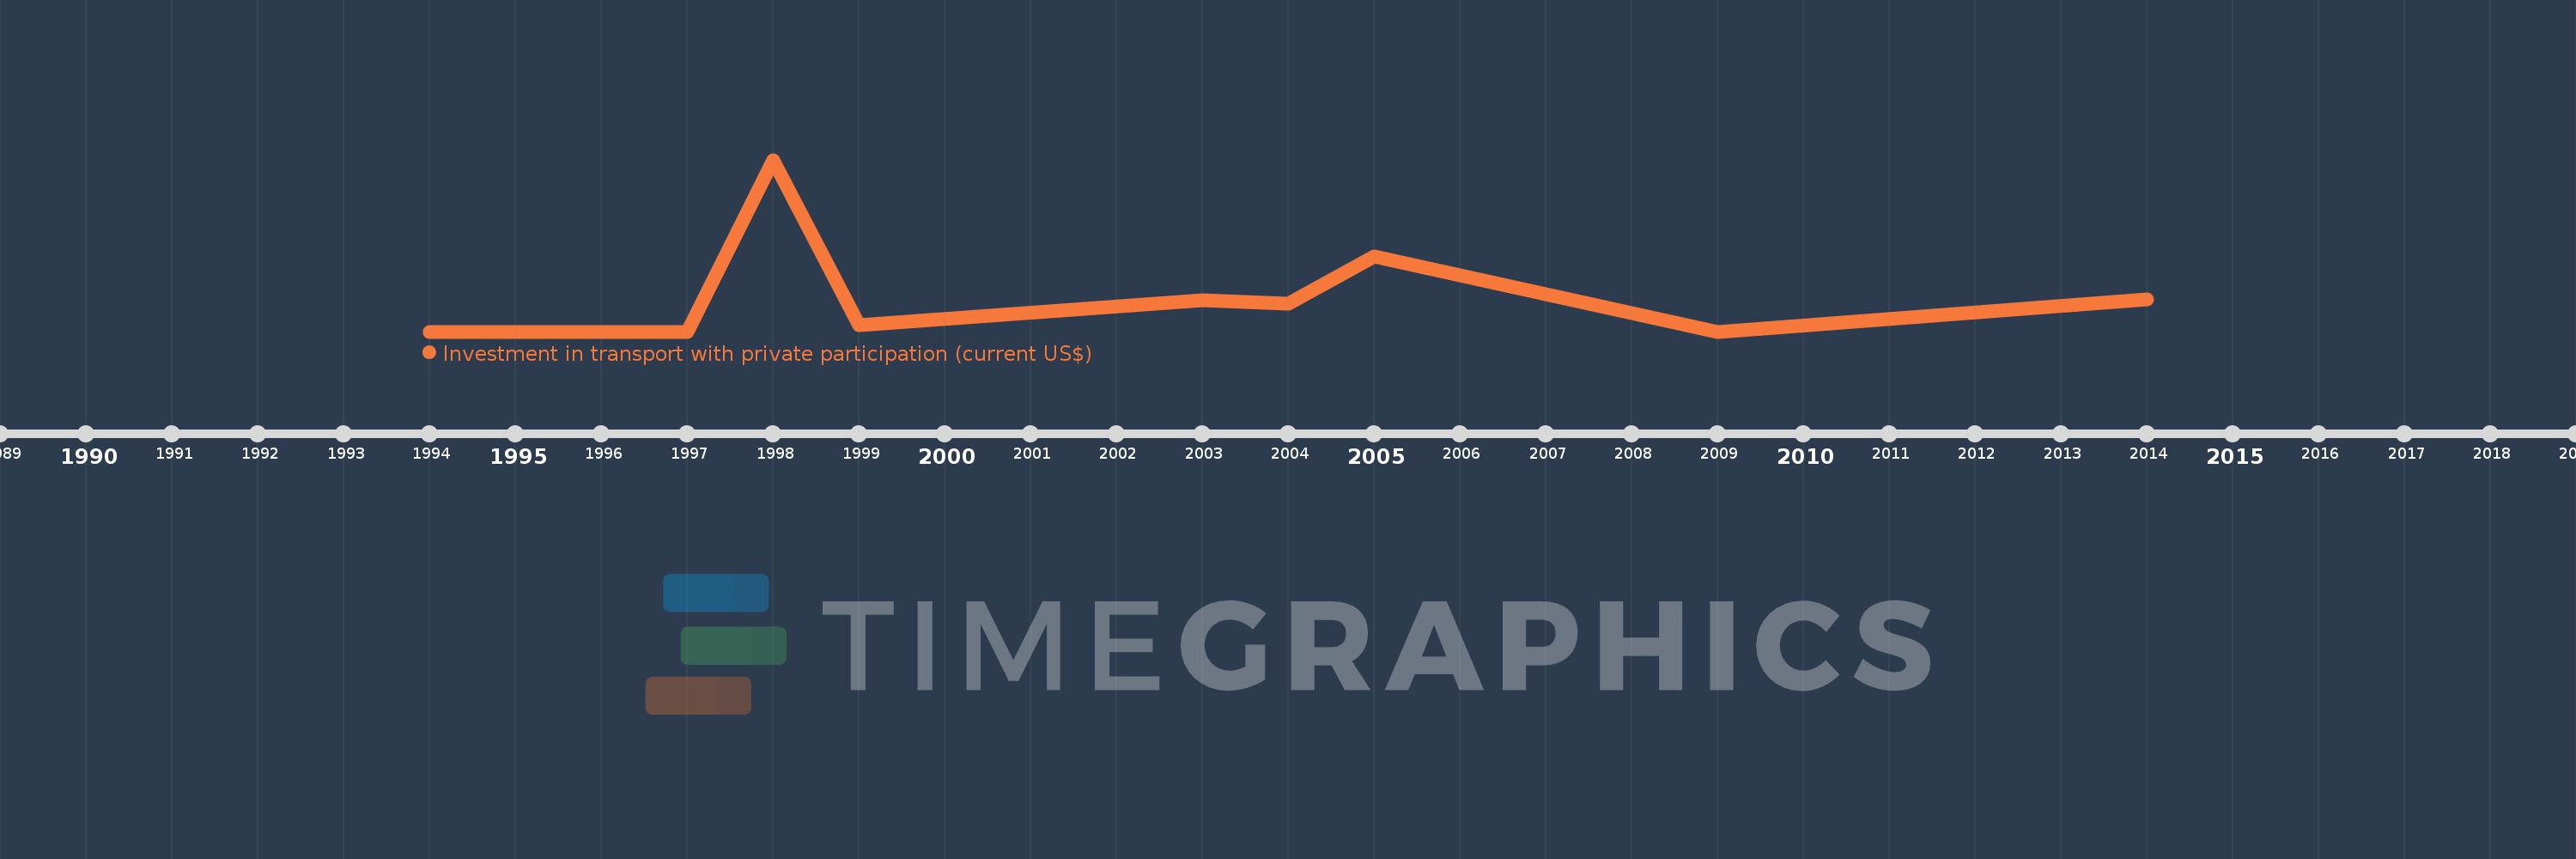
Investment in transport with private participation (current US$)
2014,2009,2005,2004,2003,1999,1998,1997,1994
This statistics in other country:
Timeline:
This timeline shows a graph from 1994 to 2014 of Mozambique. No data until 1993. Number of actual observations by date: 9.
Source name:
World Development Indicators
Source organization:
World Bank, Private Participation in Infrastructure Project Database (http://ppi.worldbank.org).
Categories, topics:
Infrastructure, Private Sector
Last updated:
apr 23, 2017
Indicators value changes by year
Maximum:
426.0 mln
jan 1, 1998
At the date of observation
Value
Absolute change
Change from previous value
jan 1, 1998
426.0 mln
+426.0 mln
%
jan 1, 1999
15.0 mln
-411.0 mln
-96.48%
jan 1, 2003
77.7 mln
+62.7 mln
418.0%
jan 1, 2004
70.0 mln
-7.7 mln
-9.91%
jan 1, 2005
186.9 mln
+116.9 mln
167.0%
jan 1, 2009
0.0
-186.9 mln
-100.0%
jan 1, 2014
80.0 mln
+80.0 mln
%
Ranking of countries by current statistics by years


Comments: