29
/
en
AIzaSyAYiBZKx7MnpbEhh9jyipgxe19OcubqV5w
April 1, 2024
156190
Indonesia
IDN
true
2
1
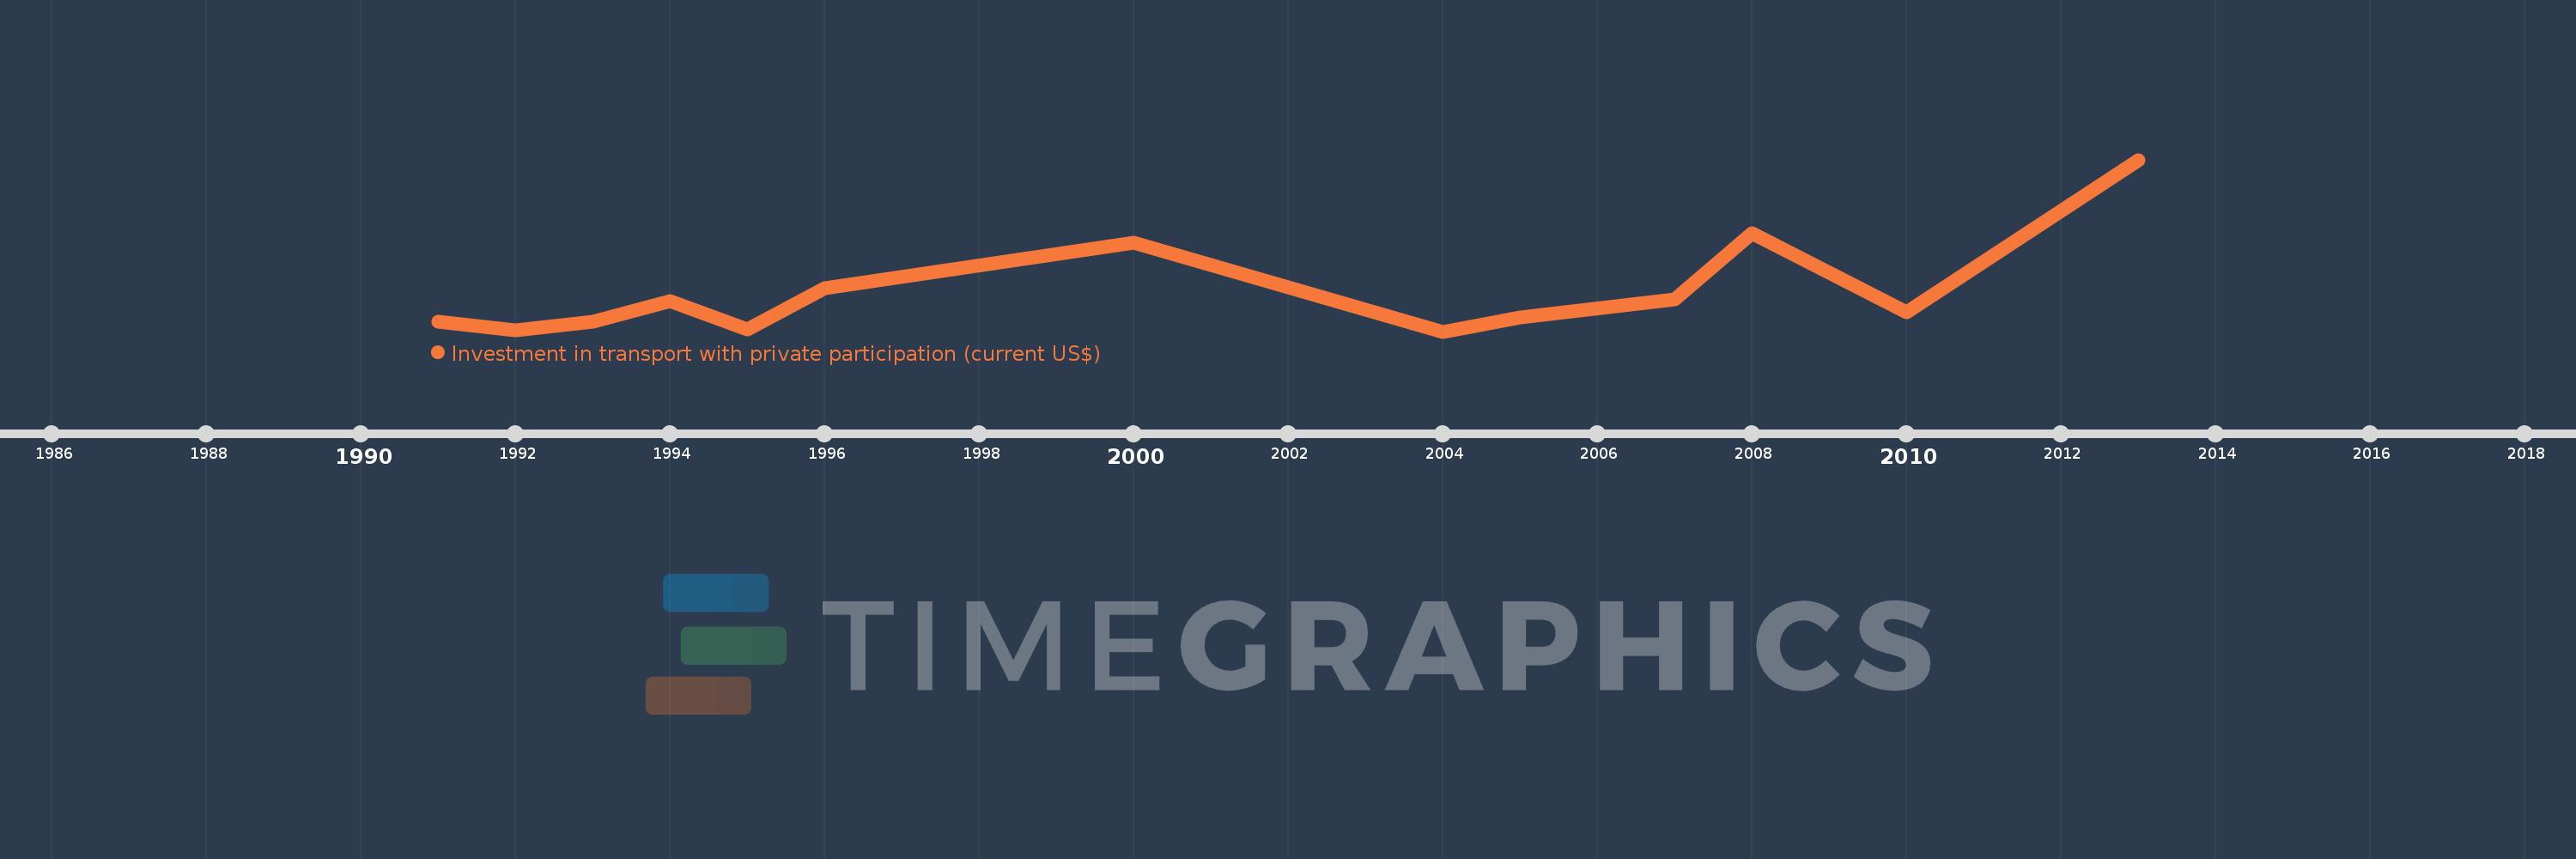
Investment in transport with private participation (current US$)
2013,2010,2008,2007,2005,2004,2000,1996,1995,1994,1993,1992,1991
This statistics in other country:
Timeline:
This timeline shows a graph from 1991 to 2013 of Indonesia. No data until 1990. Number of actual observations by date: 13.
Source name:
World Development Indicators
Source organization:
World Bank, Private Participation in Infrastructure Project Database (http://ppi.worldbank.org).
Categories, topics:
Infrastructure, Private Sector
Last updated:
apr 23, 2017
Indicators value changes by year
Maximum:
1.988 bln
jan 1, 2013
At the date of observation
Value
Absolute change
Change from previous value
jan 1, 1991
116.0 mln
+116.0 mln
0.0%
jan 1, 1992
10.8 mln
-105.2 mln
-90.69%
jan 1, 1993
114.5 mln
+103.7 mln
960.19%
jan 1, 1994
351.5 mln
+237.0 mln
206.99%
jan 1, 1995
26.7 mln
-324.8 mln
-92.4%
jan 1, 1996
502.8 mln
+476.1 mln
1.78K%
jan 1, 2000
1.028 bln
+525.2 mln
104.46%
jan 1, 2004
0.0
-1.028 bln
-100.0%
jan 1, 2005
159.2 mln
+159.2 mln
%
jan 1, 2007
372.0 mln
+212.8 mln
133.67%
jan 1, 2008
1.139 bln
+767.5 mln
206.32%
jan 1, 2010
220.0 mln
-919.5 mln
-80.69%
jan 1, 2013
1.988 bln
+1.768 bln
803.86%
Ranking of countries by current statistics by years


Comments: