29
/
en
AIzaSyAYiBZKx7MnpbEhh9jyipgxe19OcubqV5w
April 1, 2024
122327
Dominican Republic
DOM
true
2
1
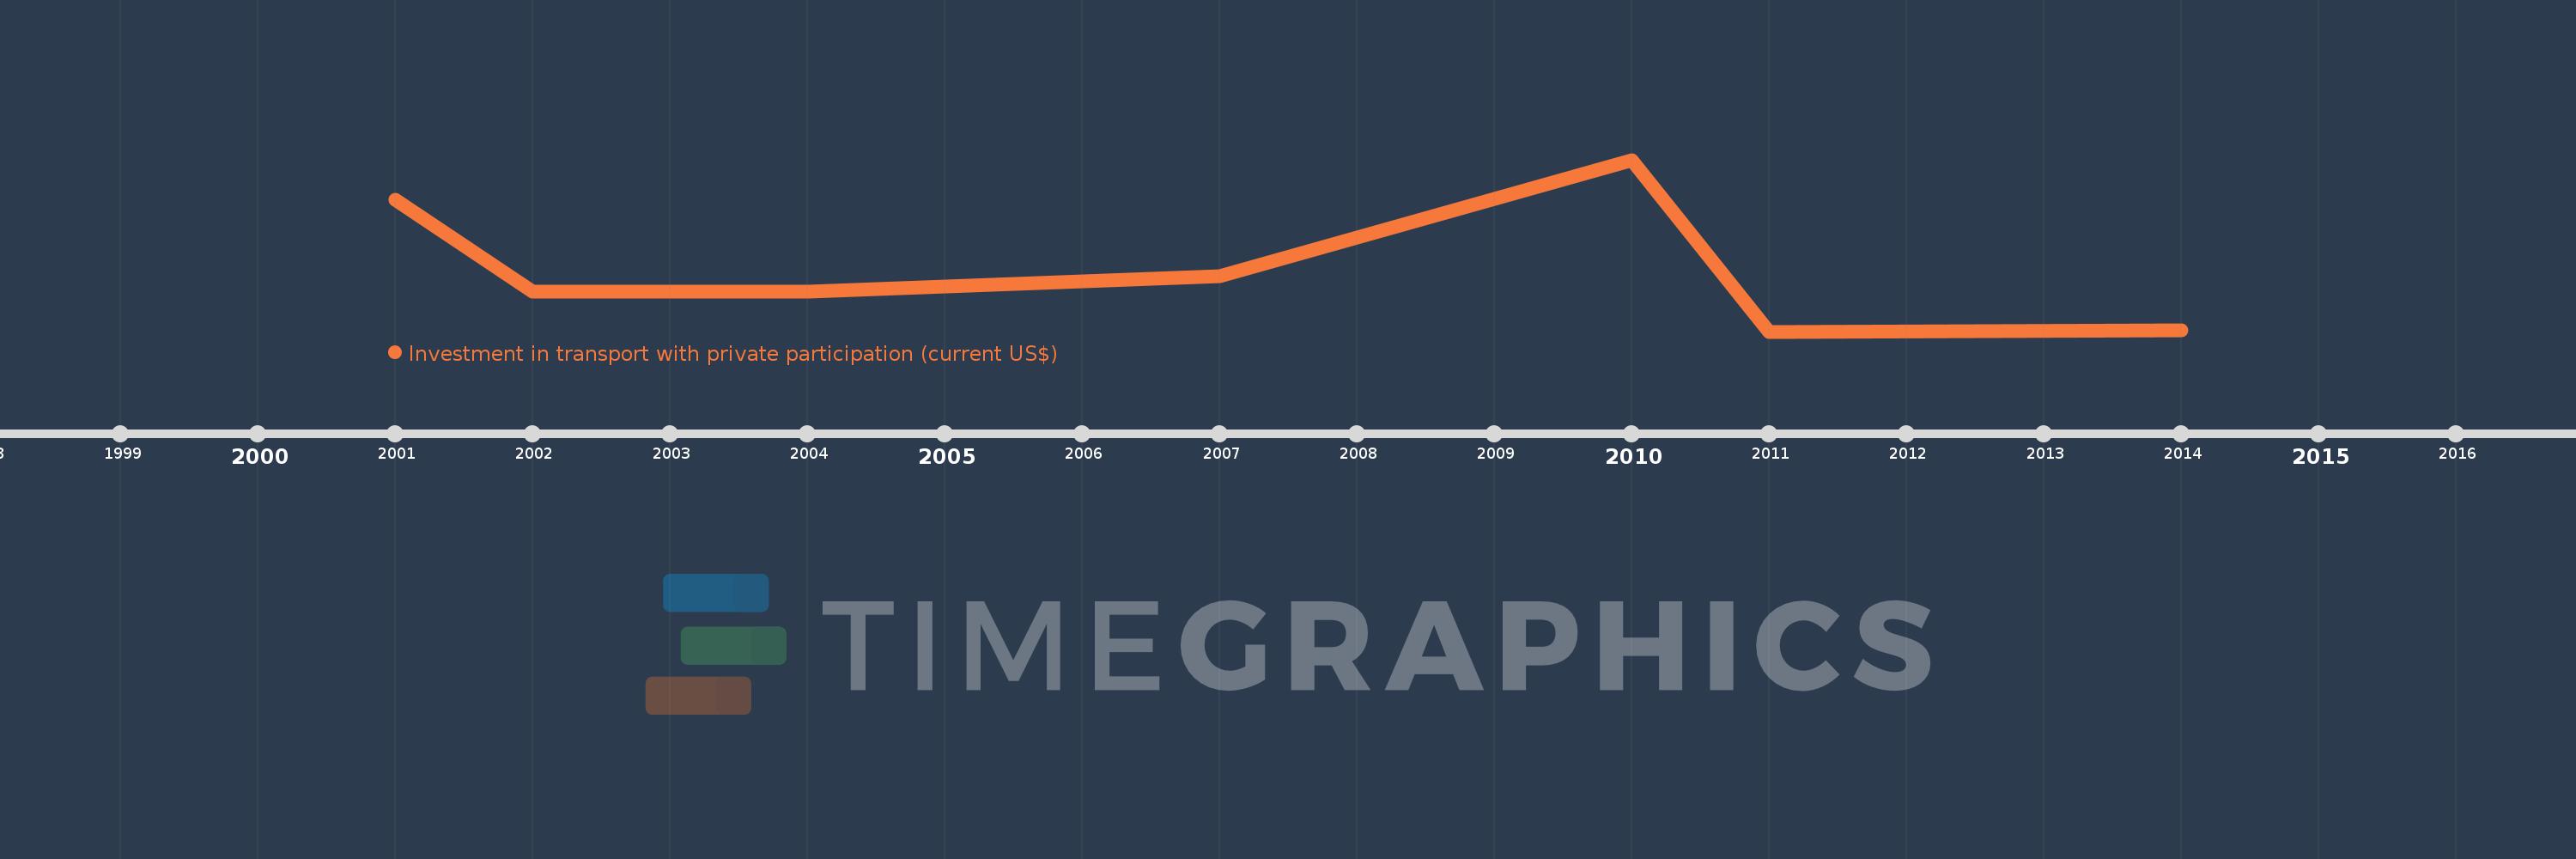
Investment in transport with private participation (current US$)
2014,2011,2010,2007,2004,2002,2001
This statistics in other country:
Timeline:
This timeline shows a graph from 2001 to 2014 of Dominican Republic. No data until 2000. Number of actual observations by date: 7.
Source name:
World Development Indicators
Source organization:
World Bank, Private Participation in Infrastructure Project Database (http://ppi.worldbank.org).
Categories, topics:
Infrastructure, Private Sector
Last updated:
apr 23, 2017
Indicators value changes by year
Minimum:
69.0 mln
jan 1, 2011
Maximum:
629.9 mln
jan 1, 2010
At the date of observation
Value
Absolute change
Change from previous value
jan 1, 2001
498.9 mln
+498.9 mln
0.0%
jan 1, 2002
200.0 mln
-298.9 mln
-59.91%
jan 1, 2004
200.0 mln
0.0
0.0%
jan 1, 2007
250.0 mln
+50.0 mln
25.0%
jan 1, 2010
629.9 mln
+379.9 mln
151.96%
jan 1, 2011
69.0 mln
-560.9 mln
-89.05%
jan 1, 2014
73.4 mln
+4.4 mln
6.38%
Ranking of countries by current statistics by years


Comments: