29
/
en
AIzaSyAYiBZKx7MnpbEhh9jyipgxe19OcubqV5w
April 1, 2024
112448
Costa Rica
CRI
true
2
1
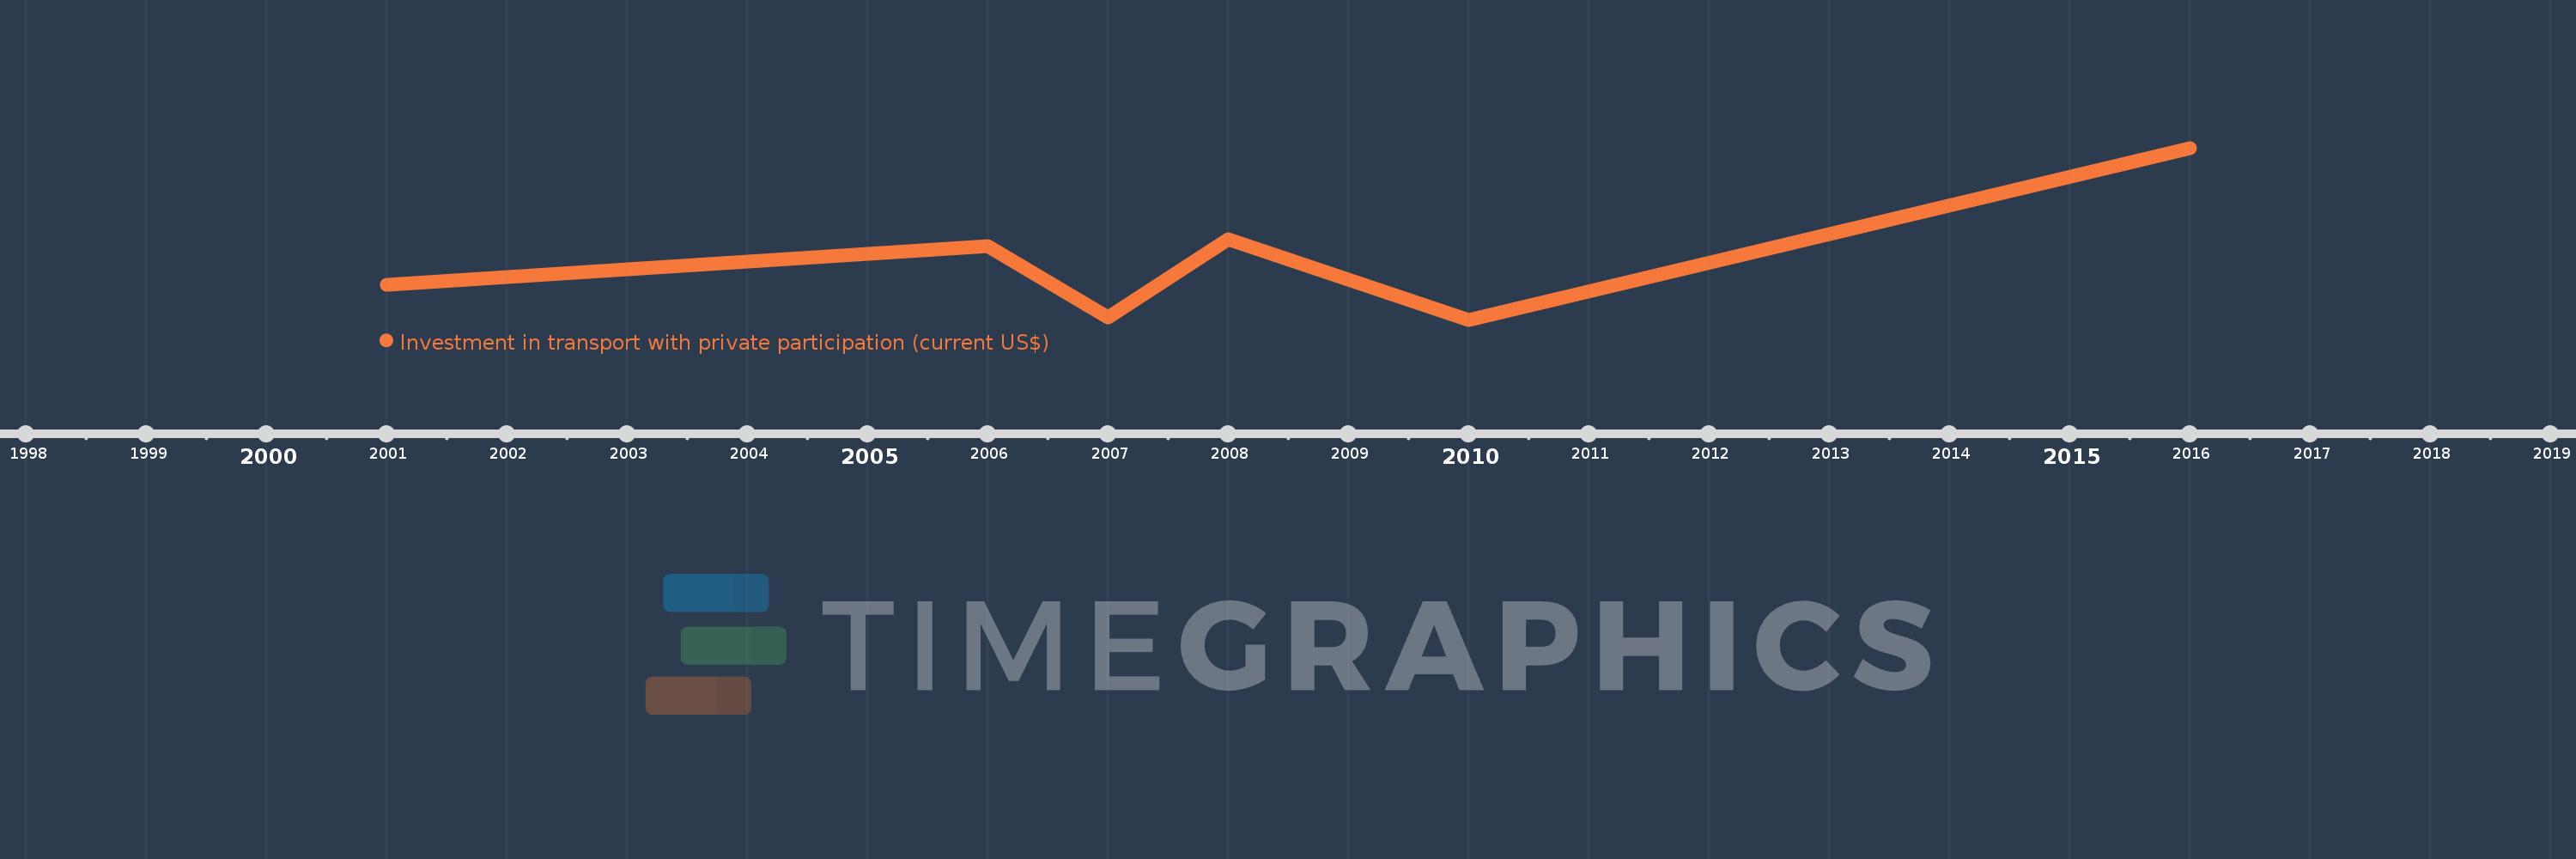
Investment in transport with private participation (current US$)
2016,2010,2008,2007,2006,2001
This statistics in other country:
Timeline:
This timeline shows a graph from 2001 to 2016 of Costa Rica. No data until 2000. Number of actual observations by date: 6.
Source name:
World Development Indicators
Source organization:
World Bank, Private Participation in Infrastructure Project Database (http://ppi.worldbank.org).
Categories, topics:
Infrastructure, Private Sector
Last updated:
apr 23, 2017
Indicators value changes by year
Minimum:
34.0 mln
jan 1, 2010
Maximum:
663.0 mln
jan 1, 2016
At the date of observation
Value
Absolute change
Change from previous value
jan 1, 2001
161.0 mln
+161.0 mln
0.0%
jan 1, 2006
304.2 mln
+143.2 mln
88.94%
jan 1, 2007
43.0 mln
-261.2 mln
-85.86%
jan 1, 2008
330.0 mln
+287.0 mln
667.44%
jan 1, 2010
34.0 mln
-296.0 mln
-89.7%
jan 1, 2016
663.0 mln
+629.0 mln
1.85K%
Ranking of countries by current statistics by years


Comments: