Download This statistics in other country:
Timeline:
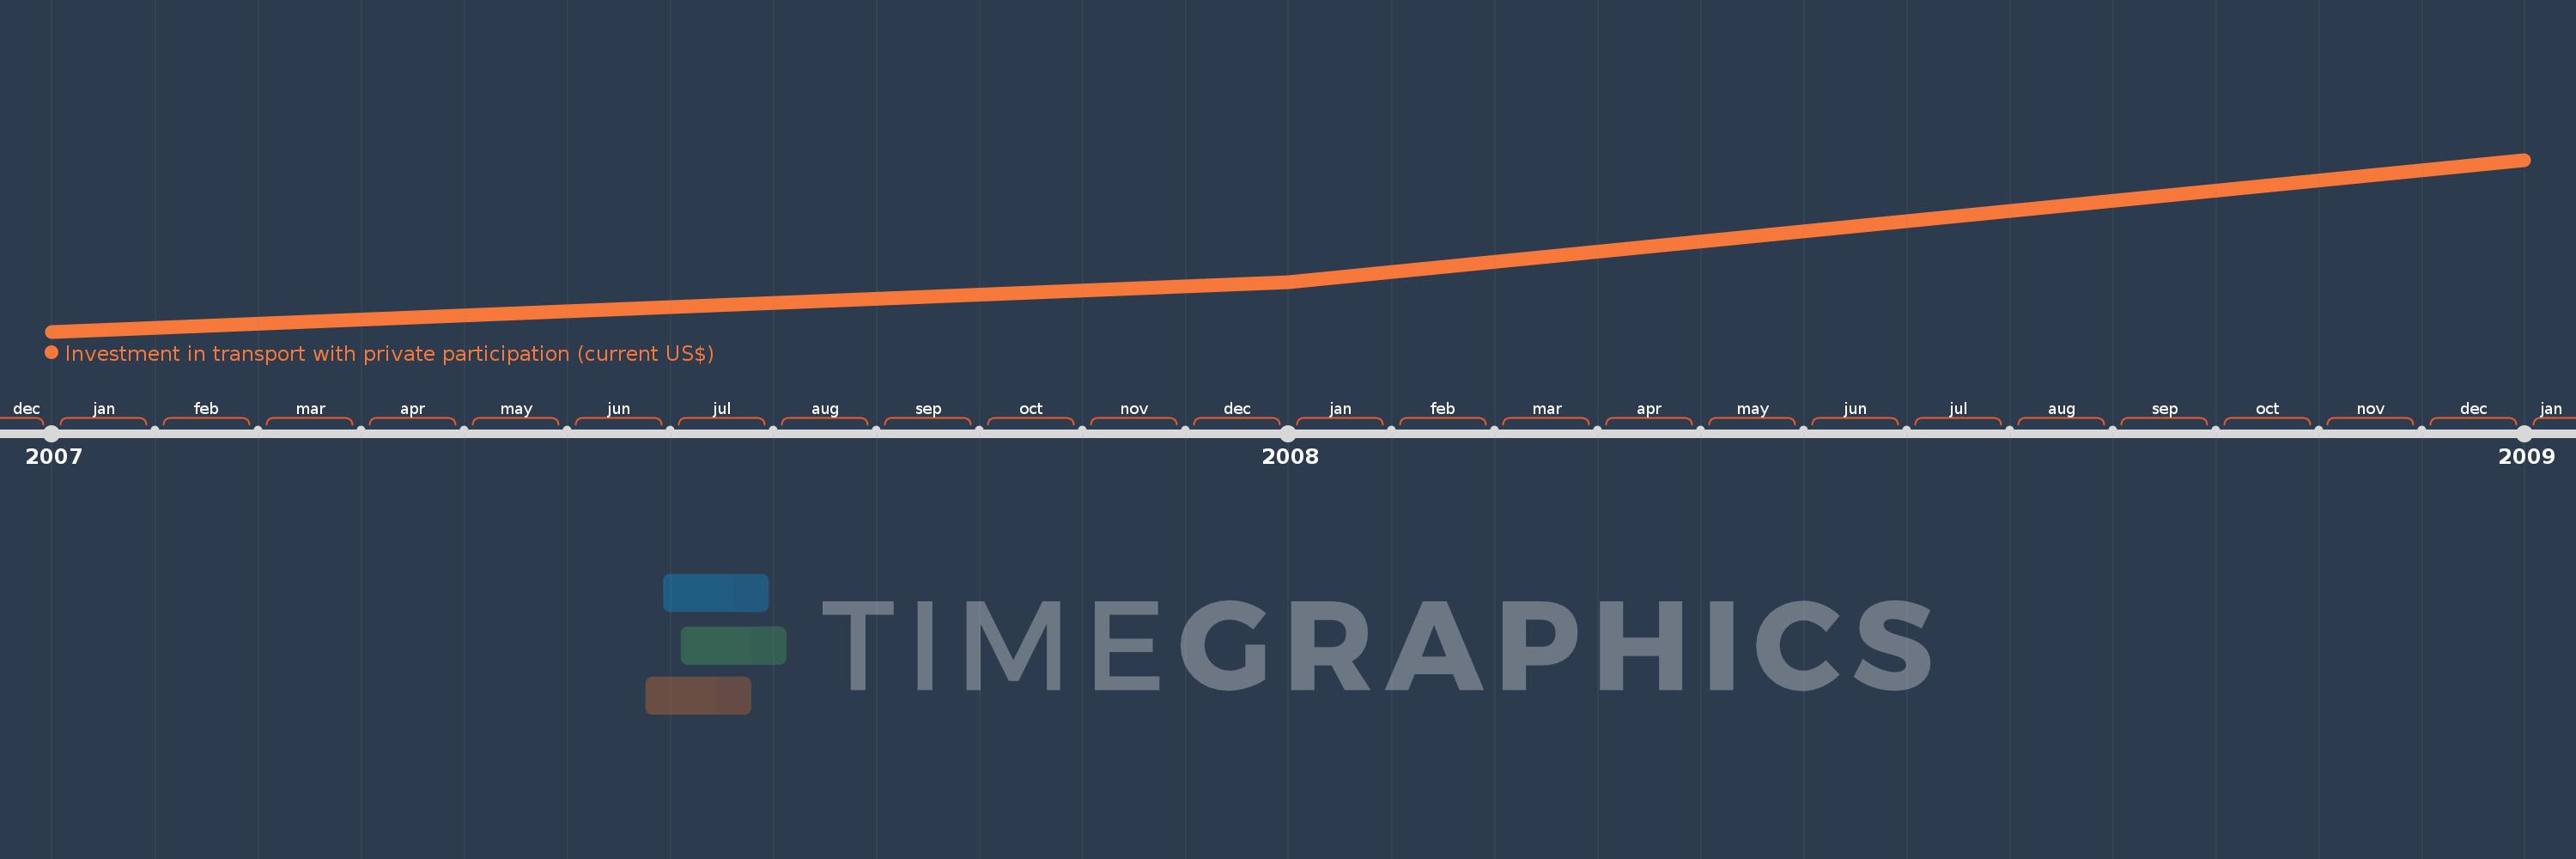
This timeline shows a graph from 2007 to 2009 of IDA blend. No data until 2006. Number of actual observations by date: 3.
Source name:
World Development Indicators
Source organization:
World Bank, Private Participation in Infrastructure Project Database (http://ppi.worldbank.org).
Categories, topics:
Infrastructure, Private Sector
Last updated:
apr 23, 2017
Indicators value changes by year
Minimum:
495.14 mln
jan 1, 2007
Maximum:
1.87 bln
jan 1, 2009
At the date of observation
Value
Absolute change
Change from the previous value
jan 1, 2007
495.14 mln
+495.14 mln
0.0%
jan 1, 2008
887.7 mln
+392.56 mln
79.28%
jan 1, 2009
1.87 bln
+982.3 mln
110.66%
Ranking of countries by current statistics by years
